01 · Climate Risk Analysis
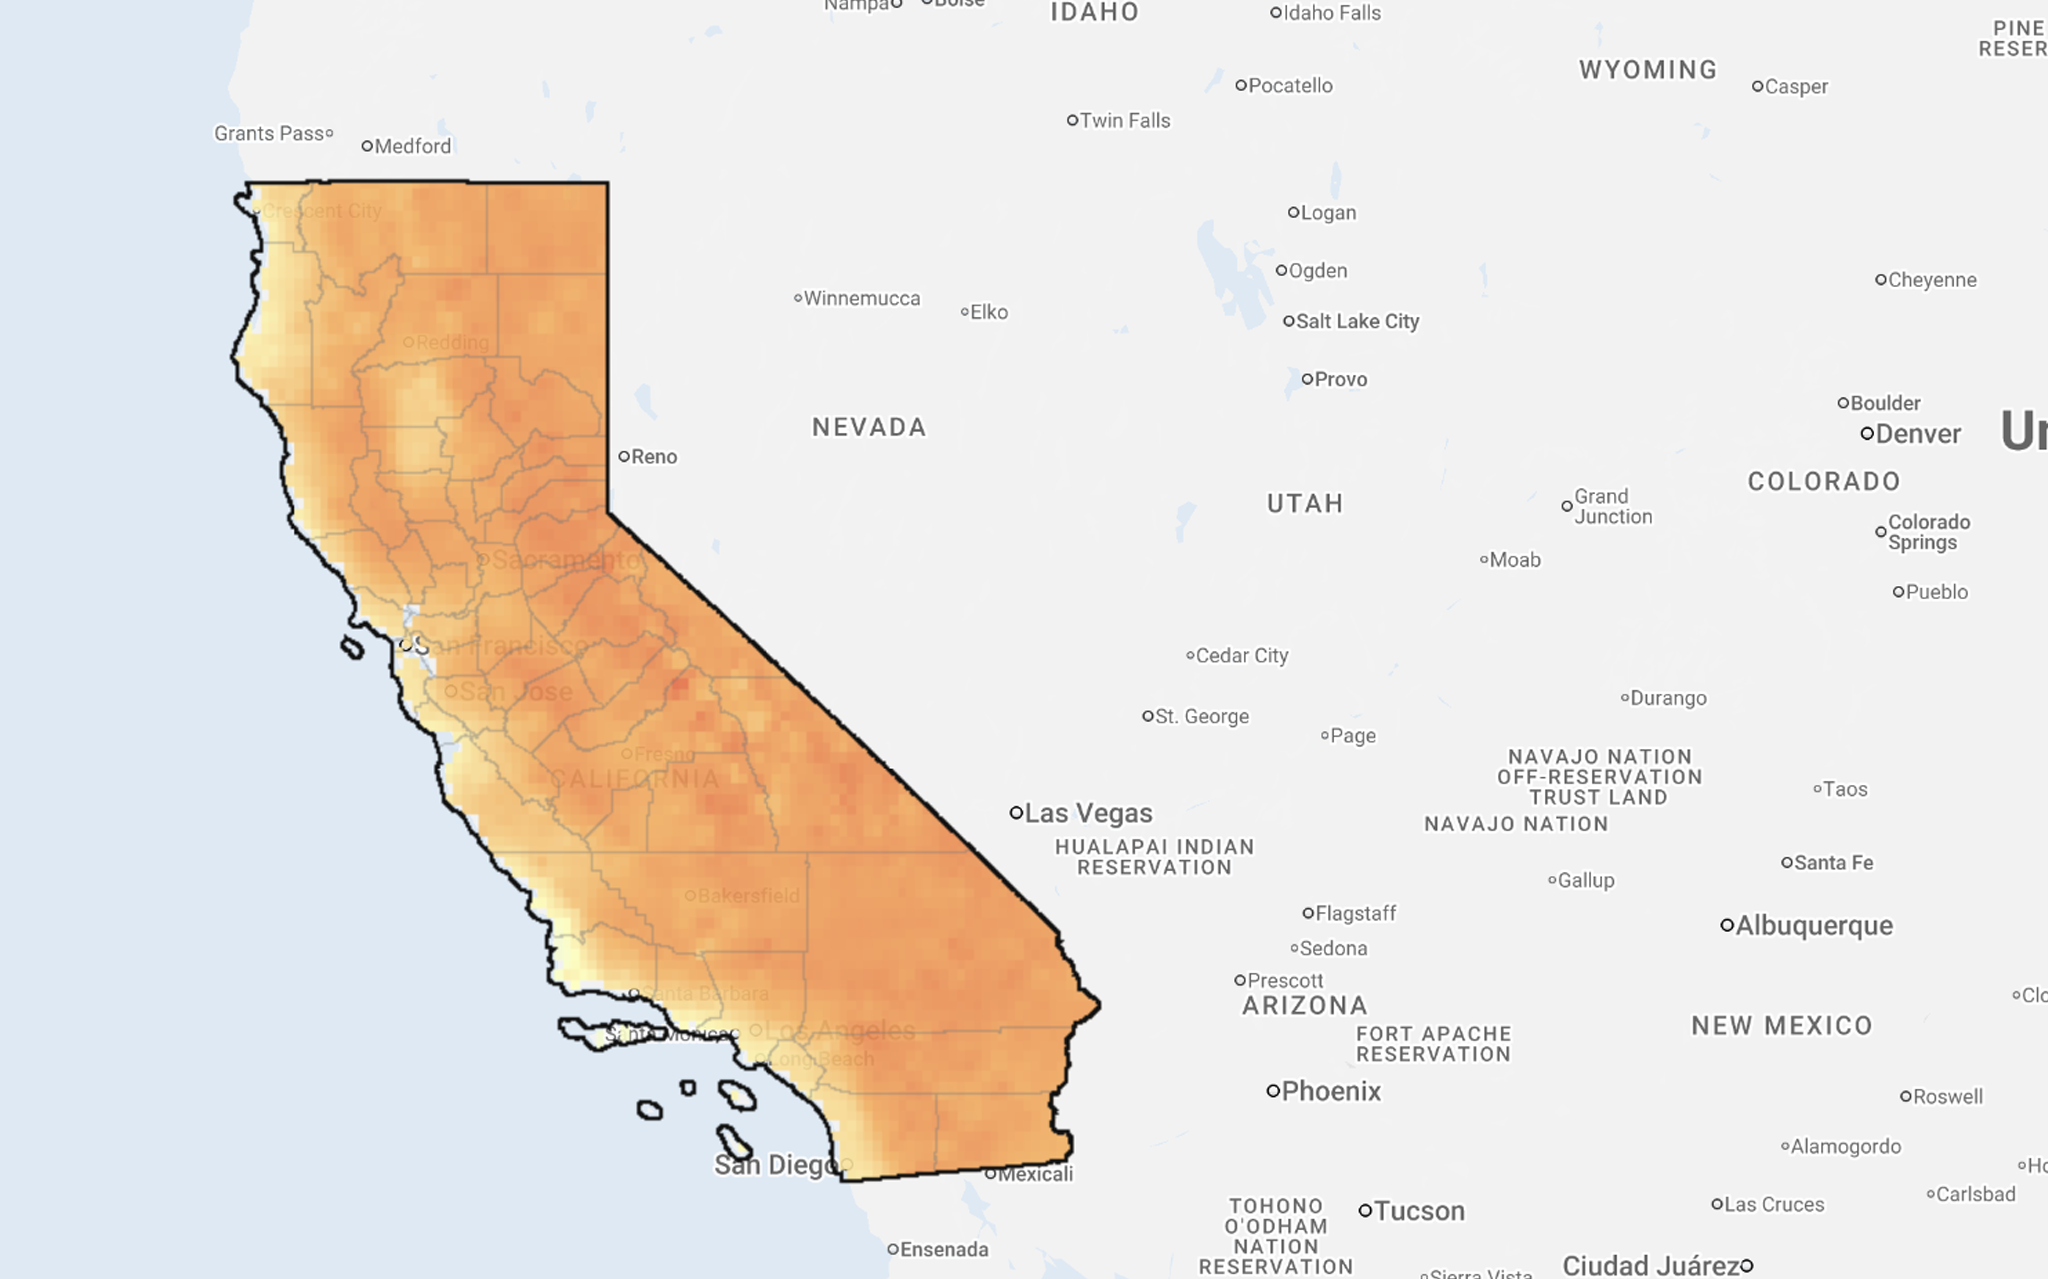
California Seasonal Temperature Dashboard
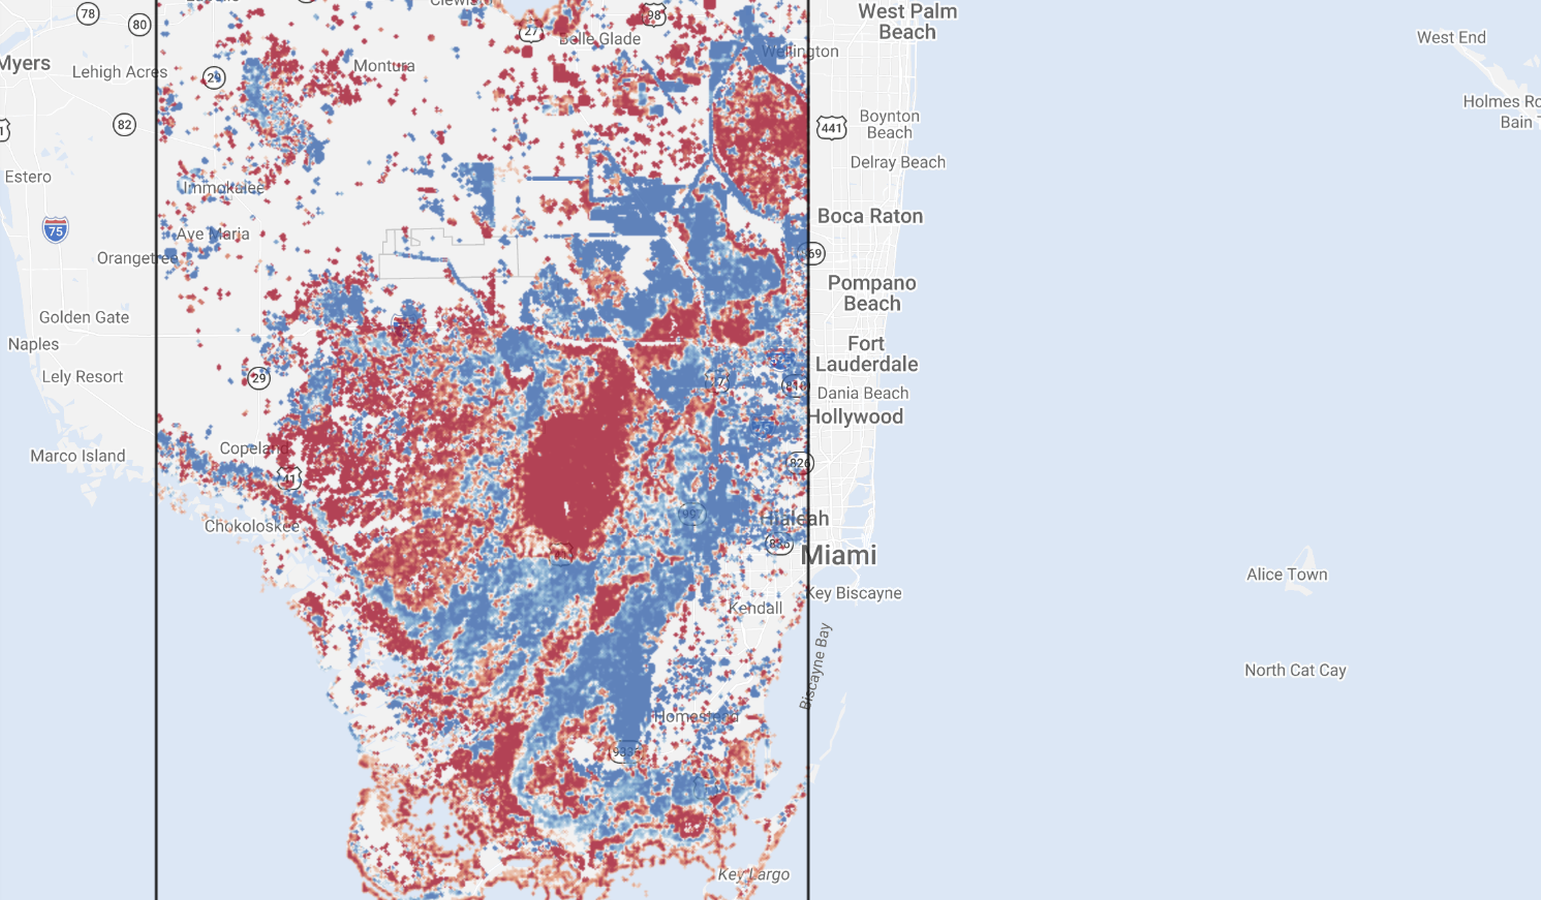
Seasonal temperature anomaly analysis comparing 2024 conditions to a 1991–2020 baseline — identifying where warming trends exceed historical norms to support climate adaptation planning.