The Challenge
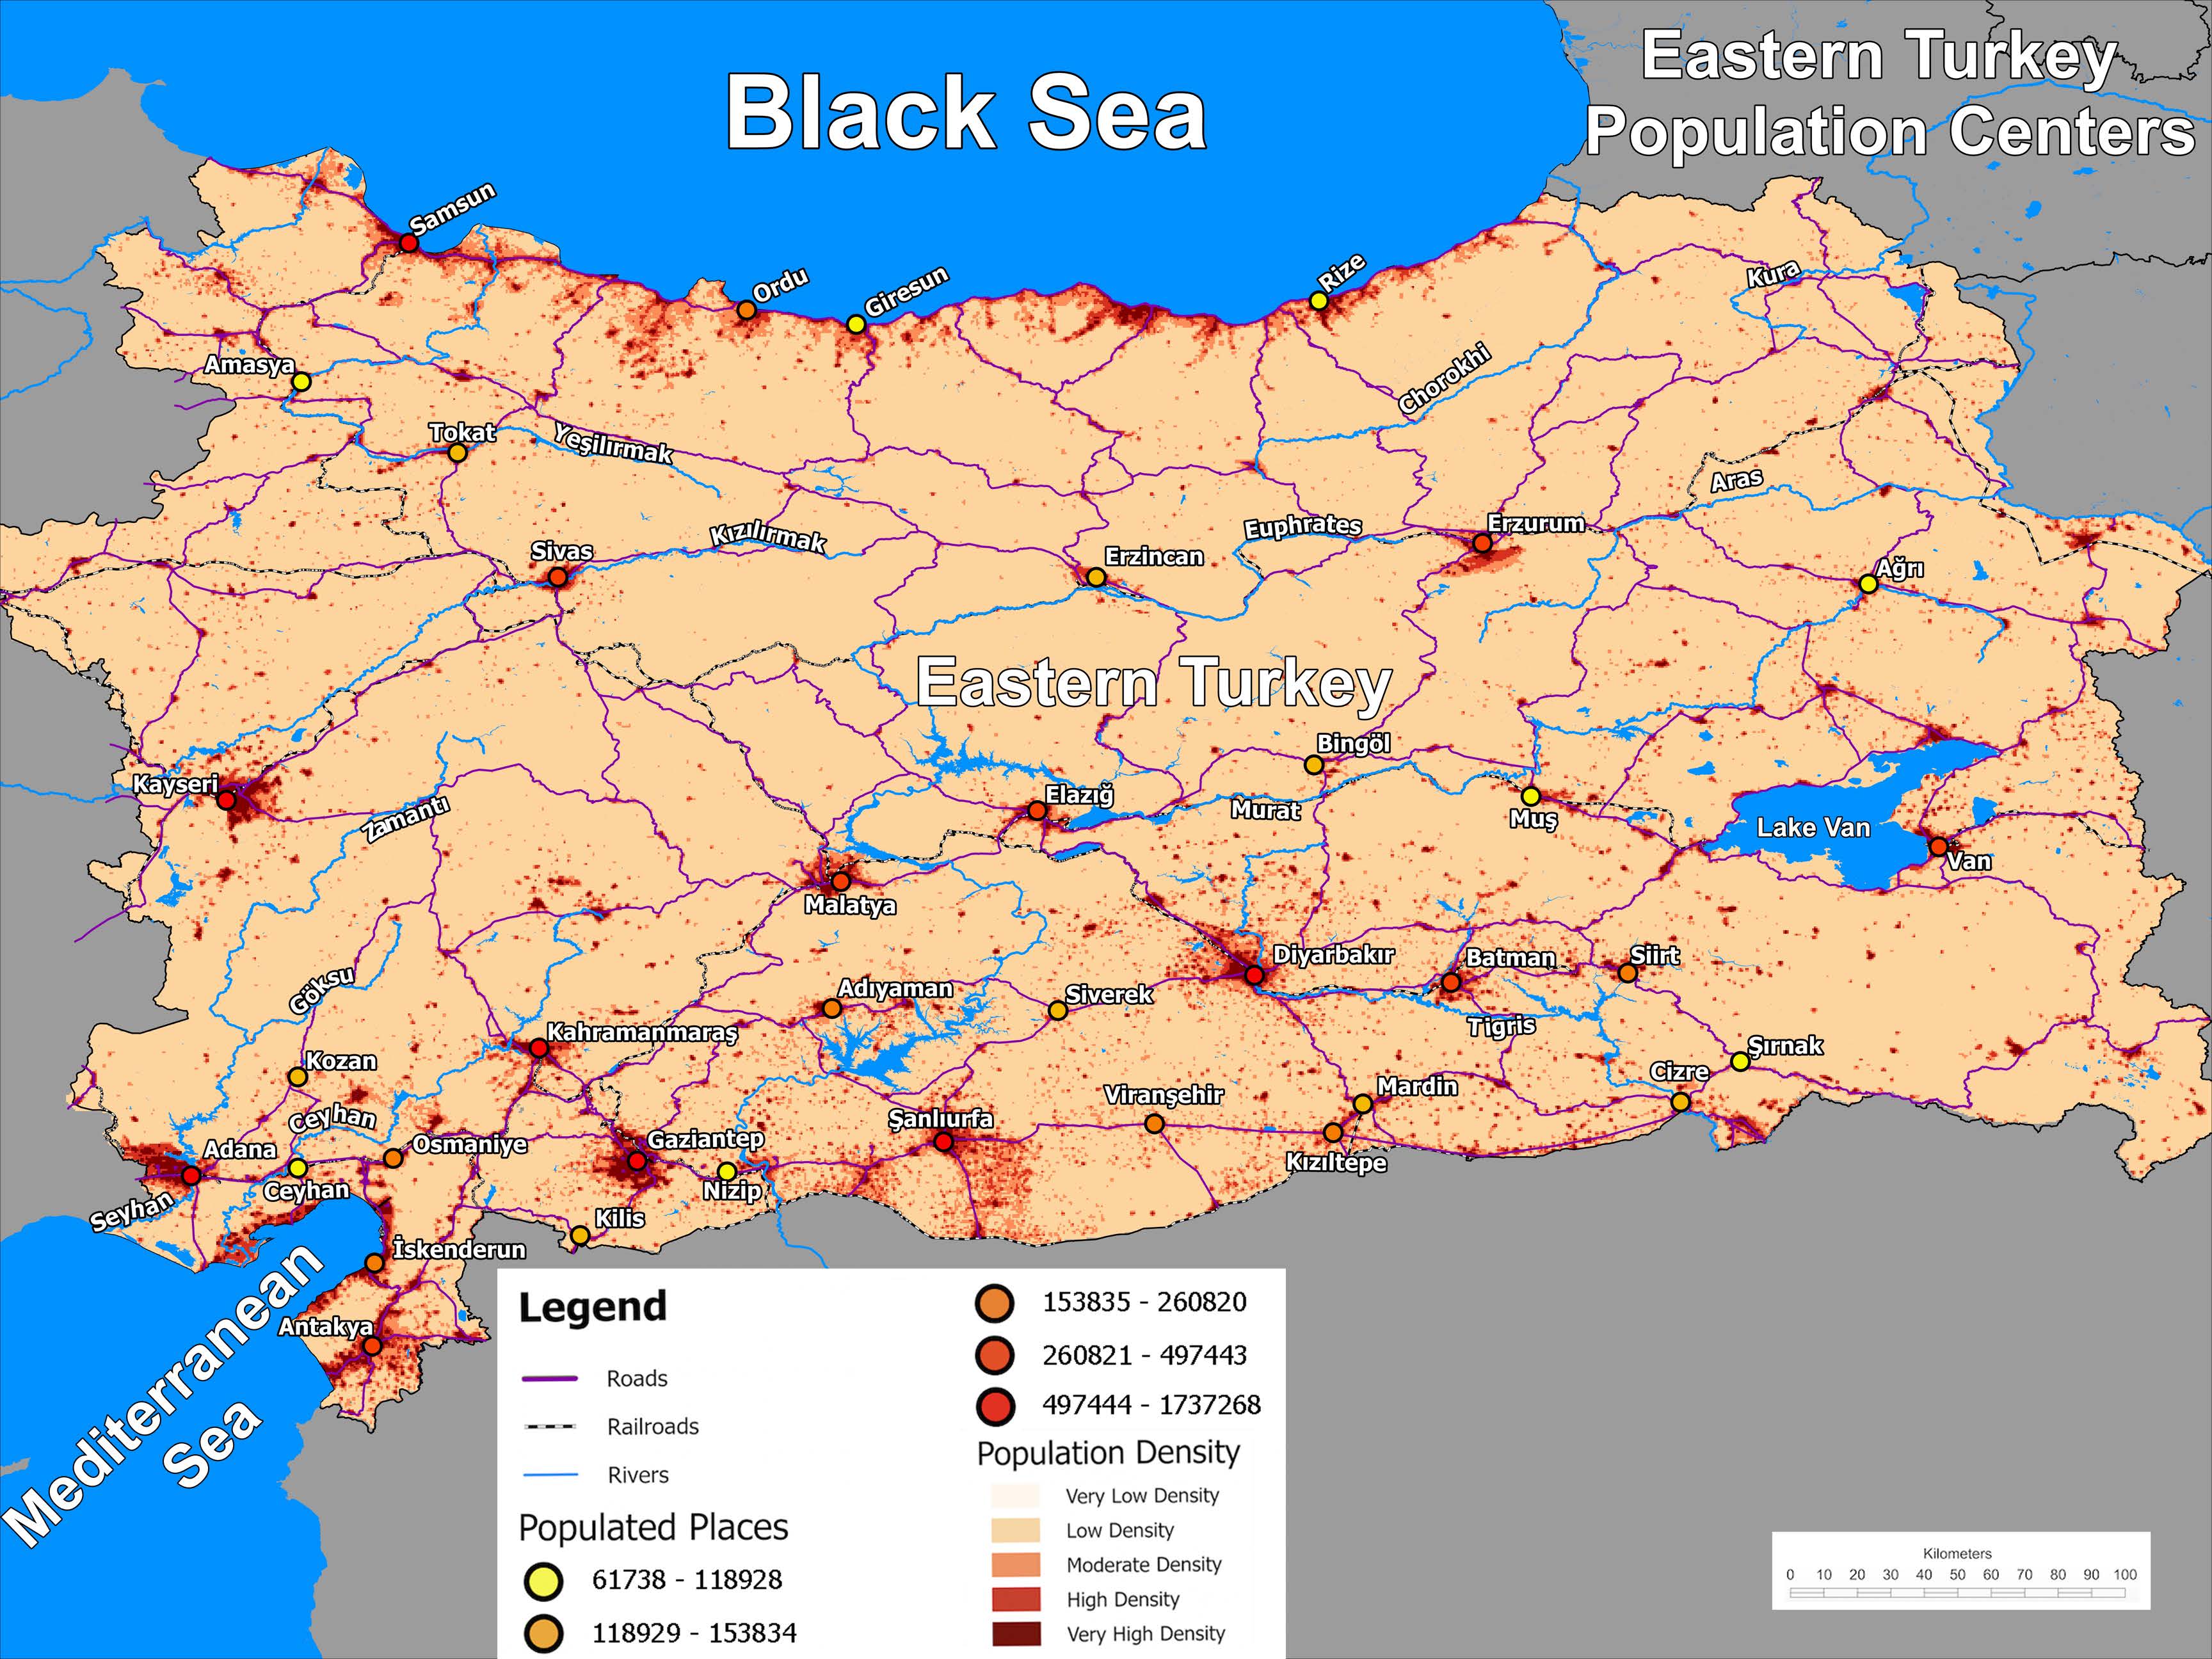
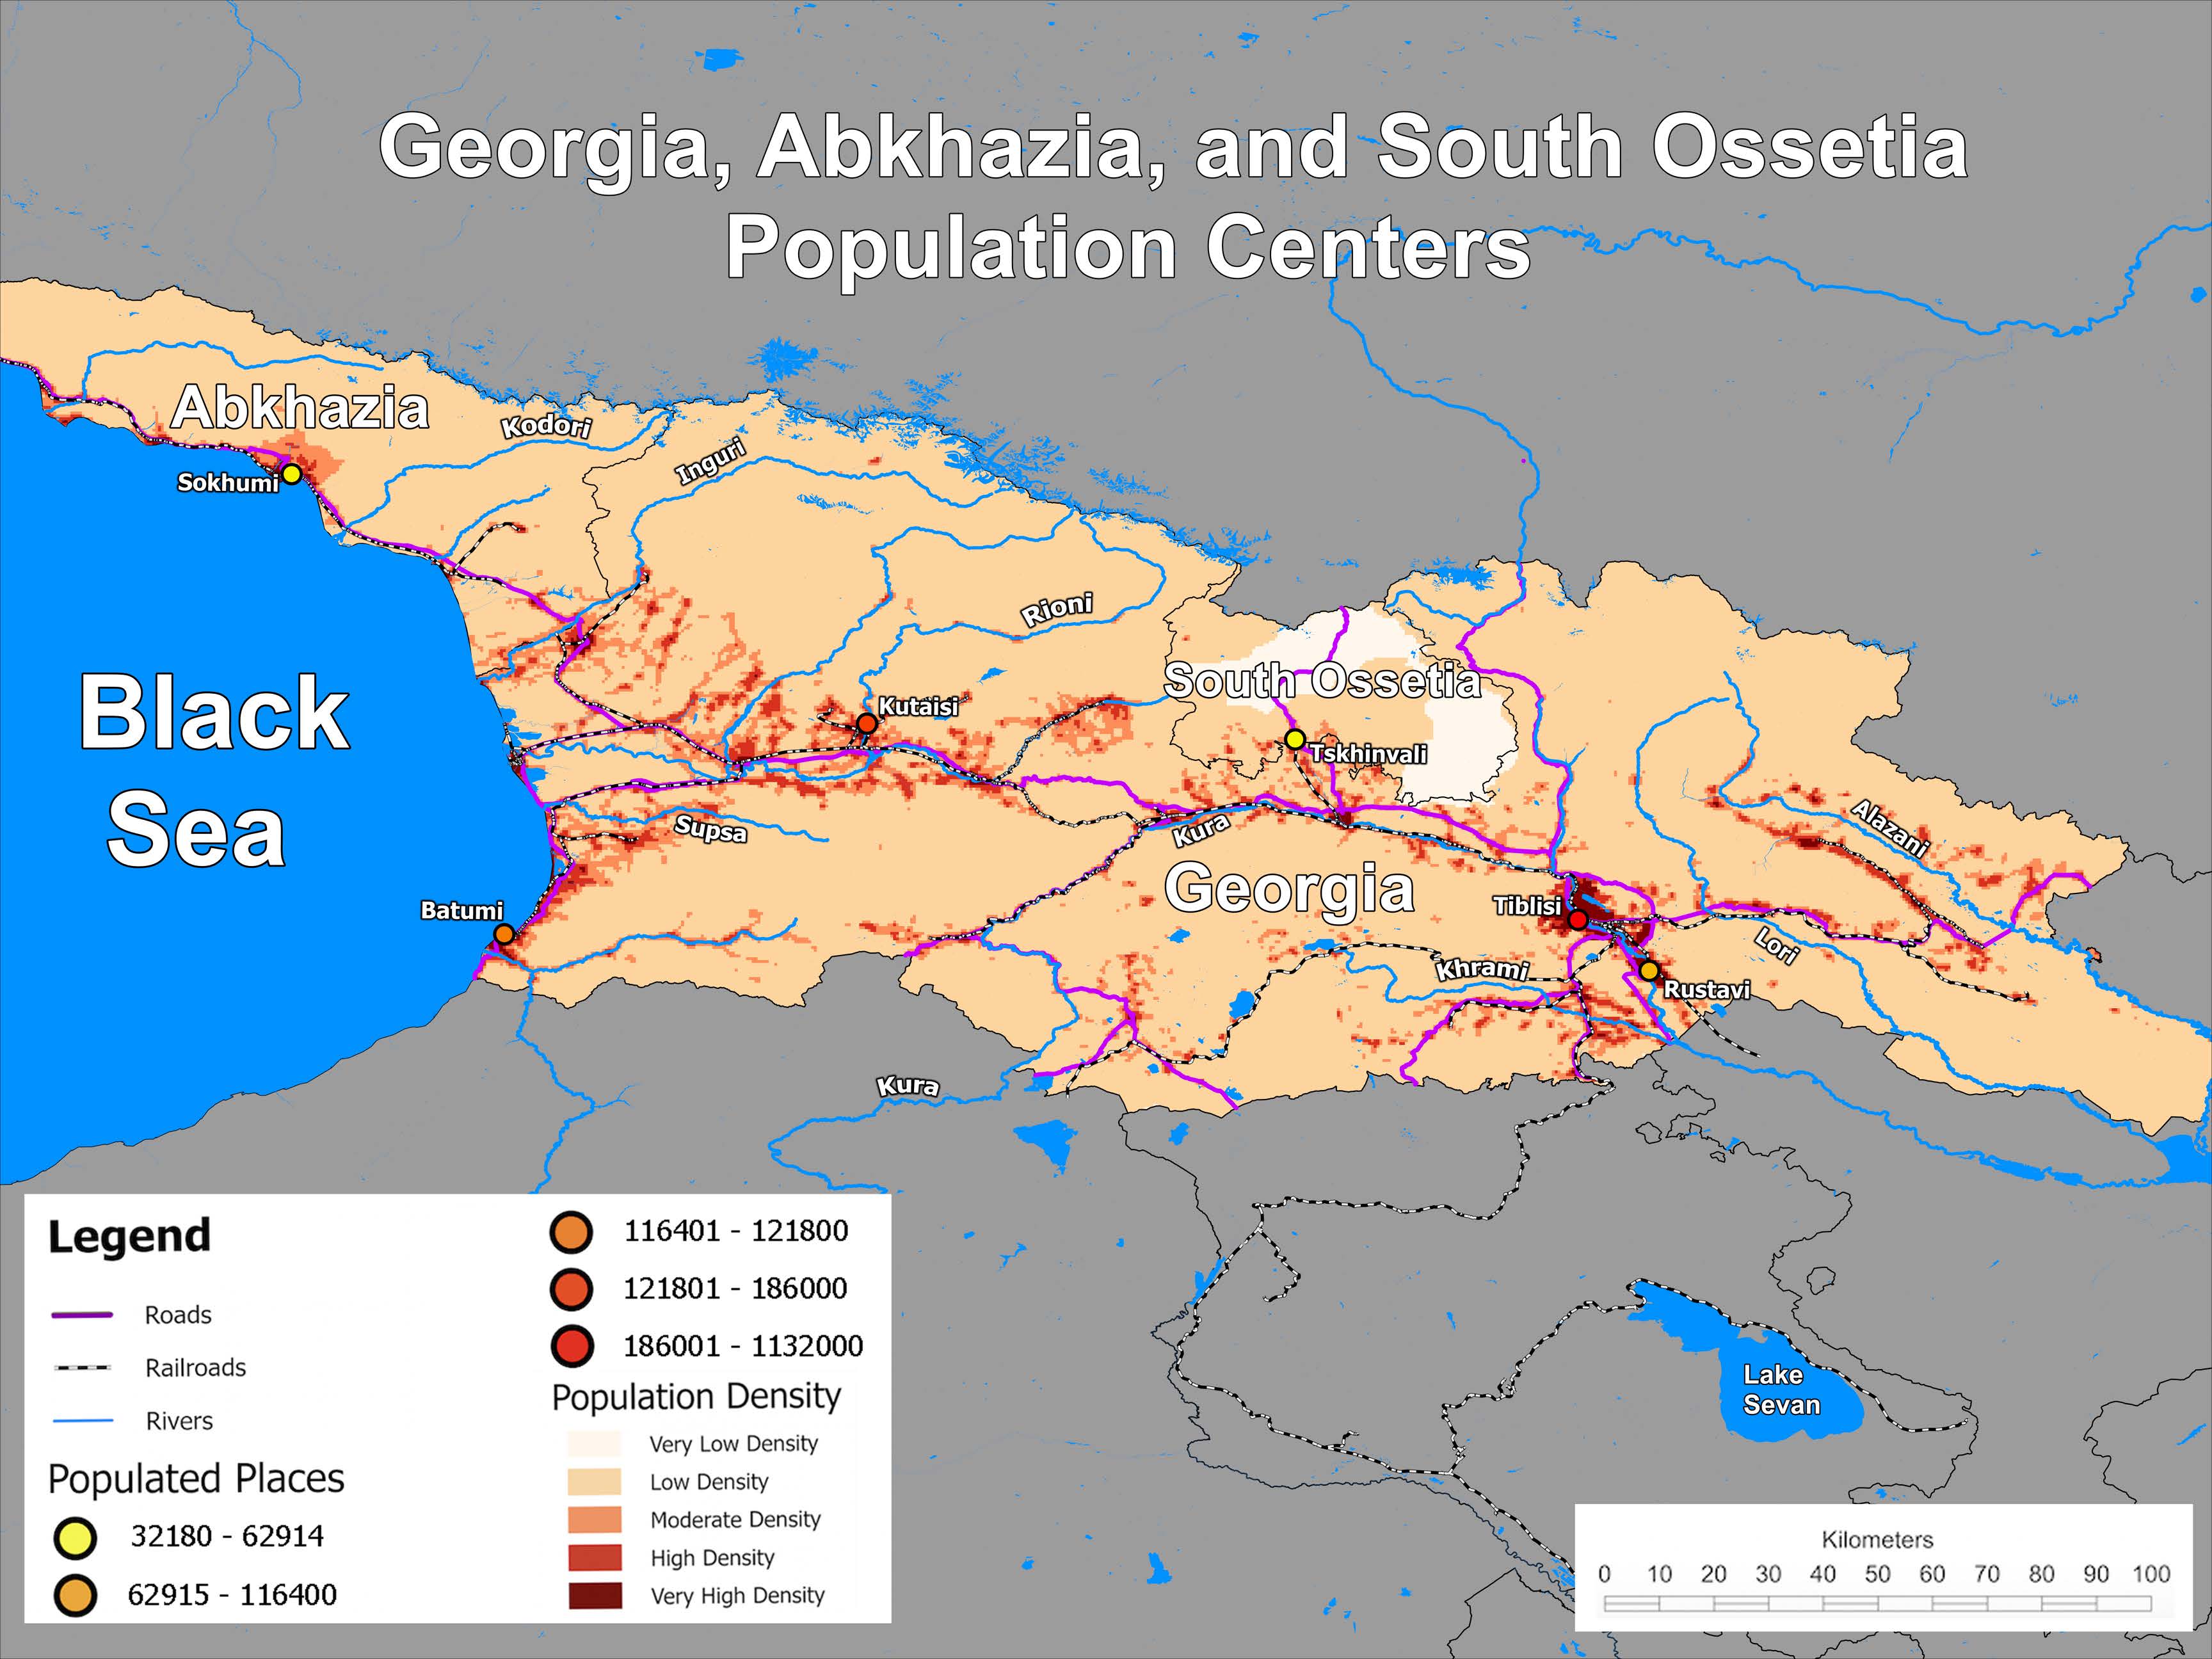
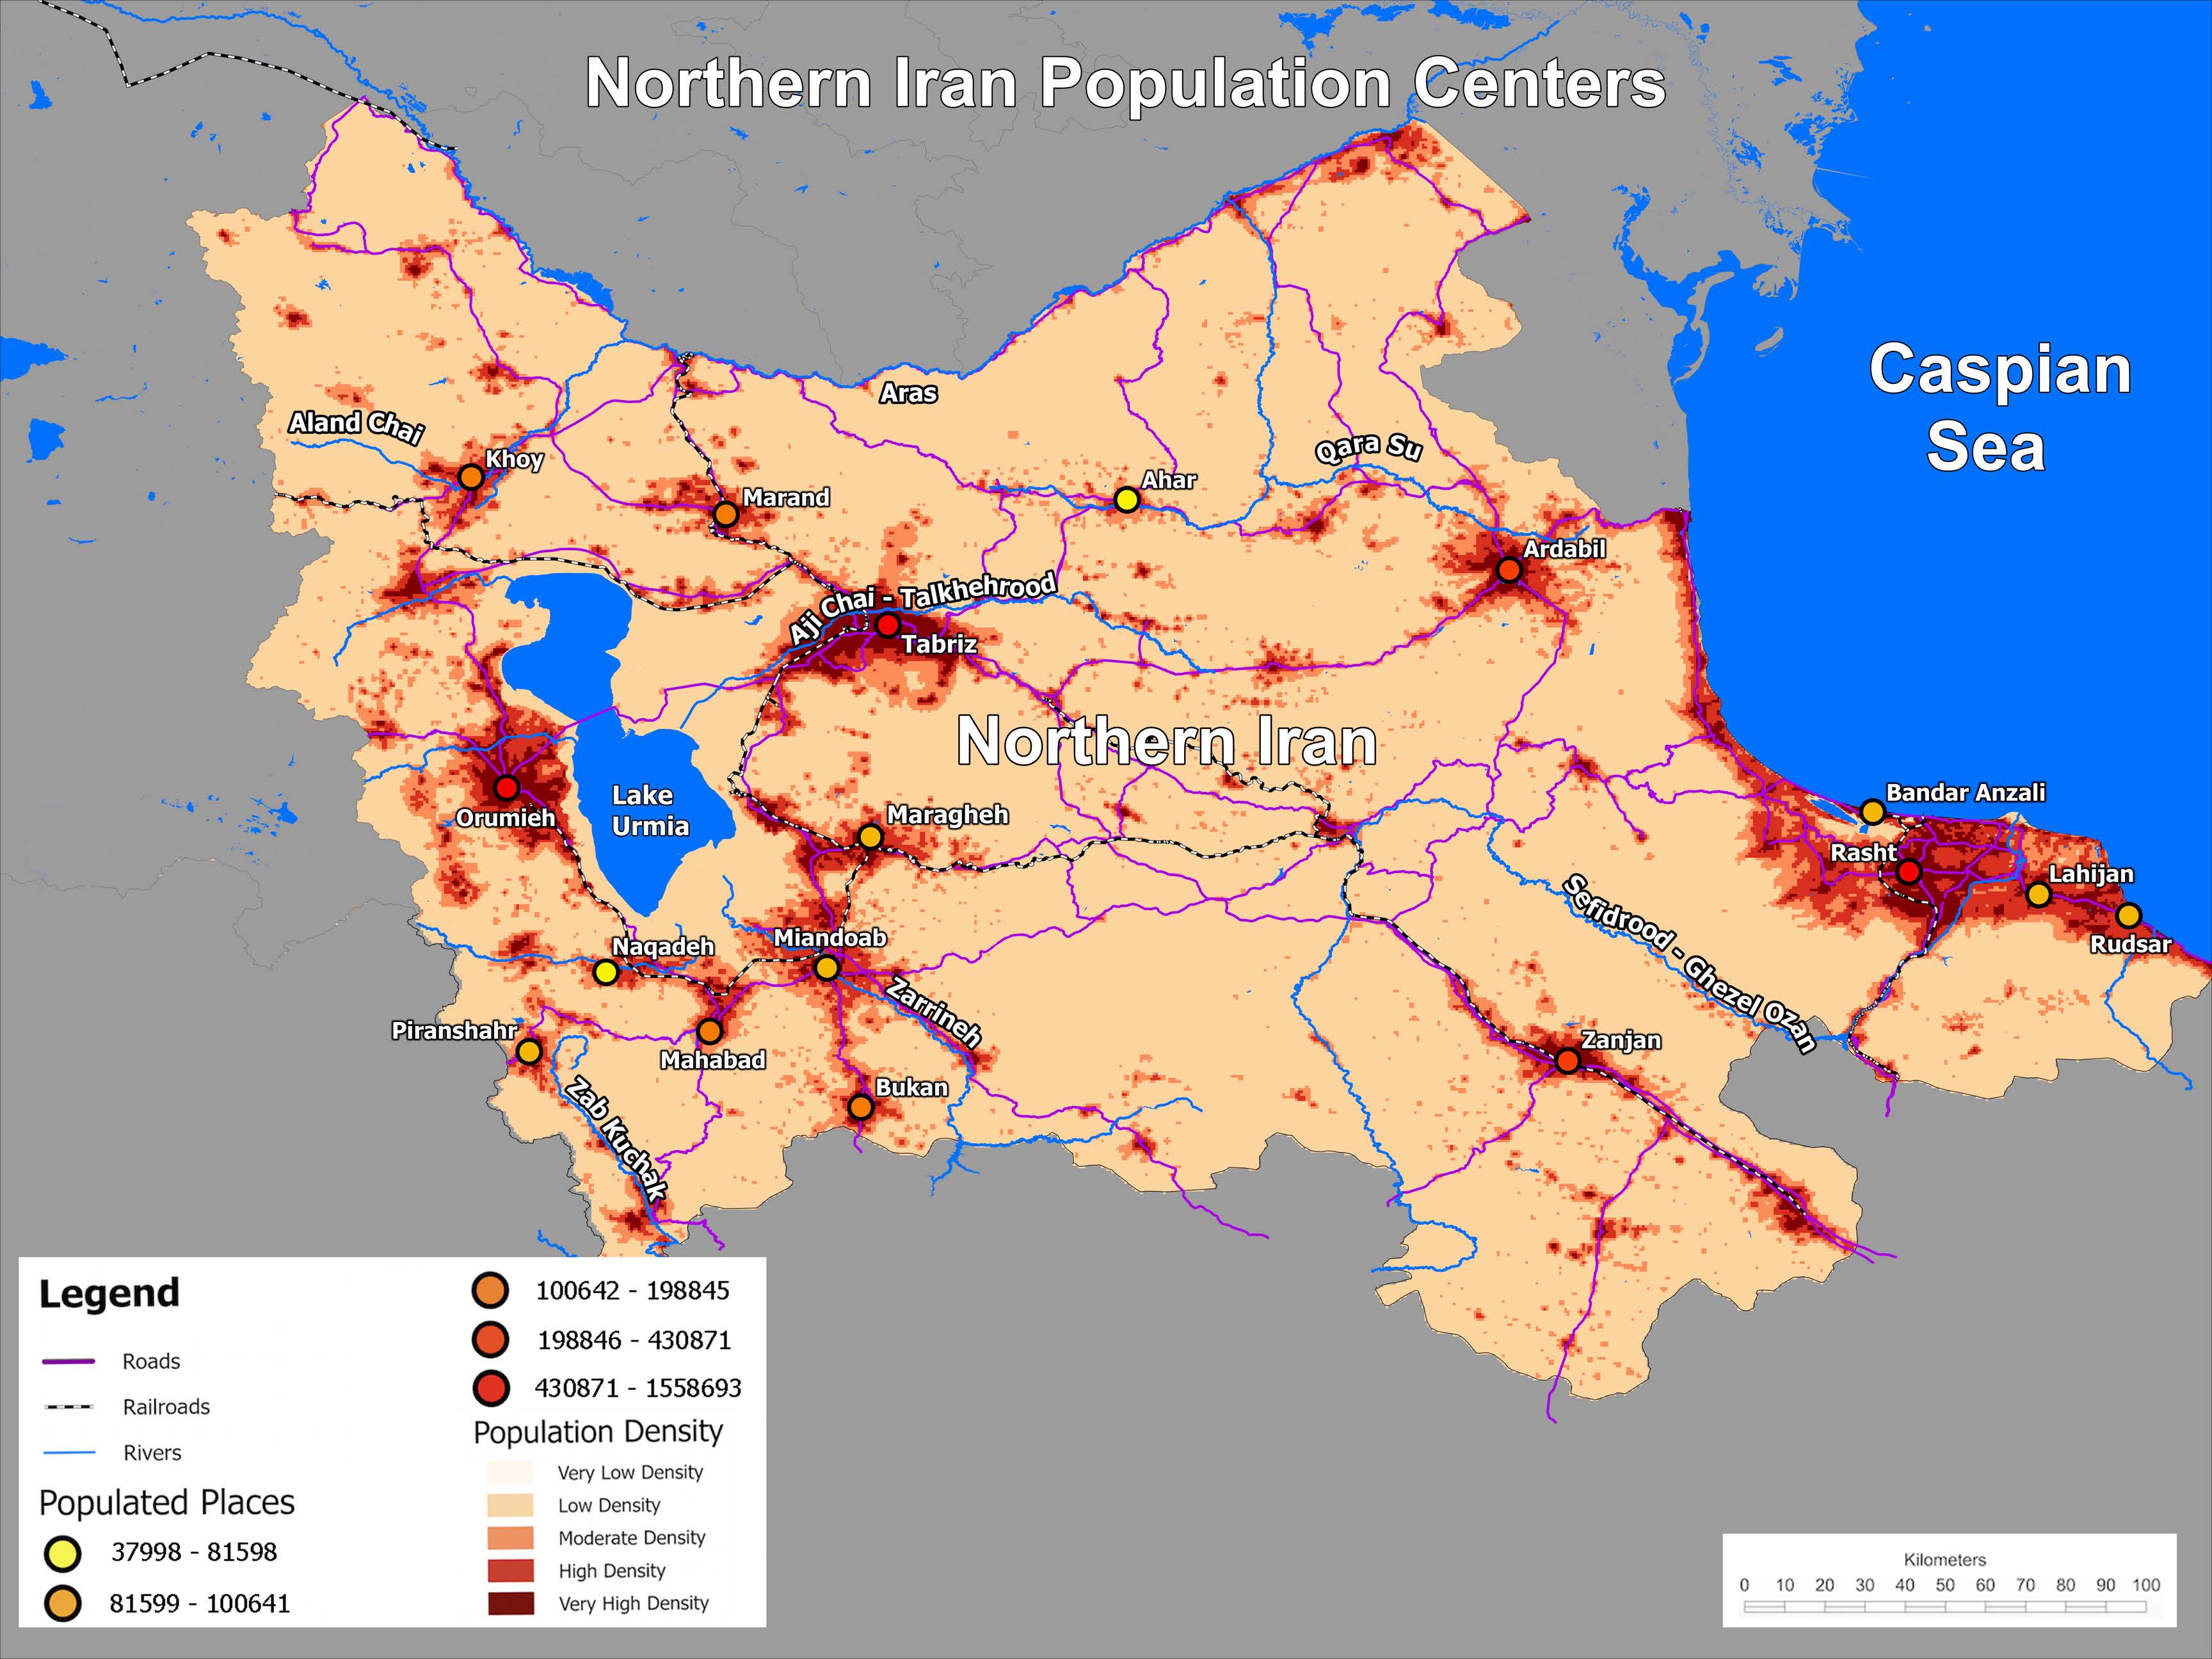
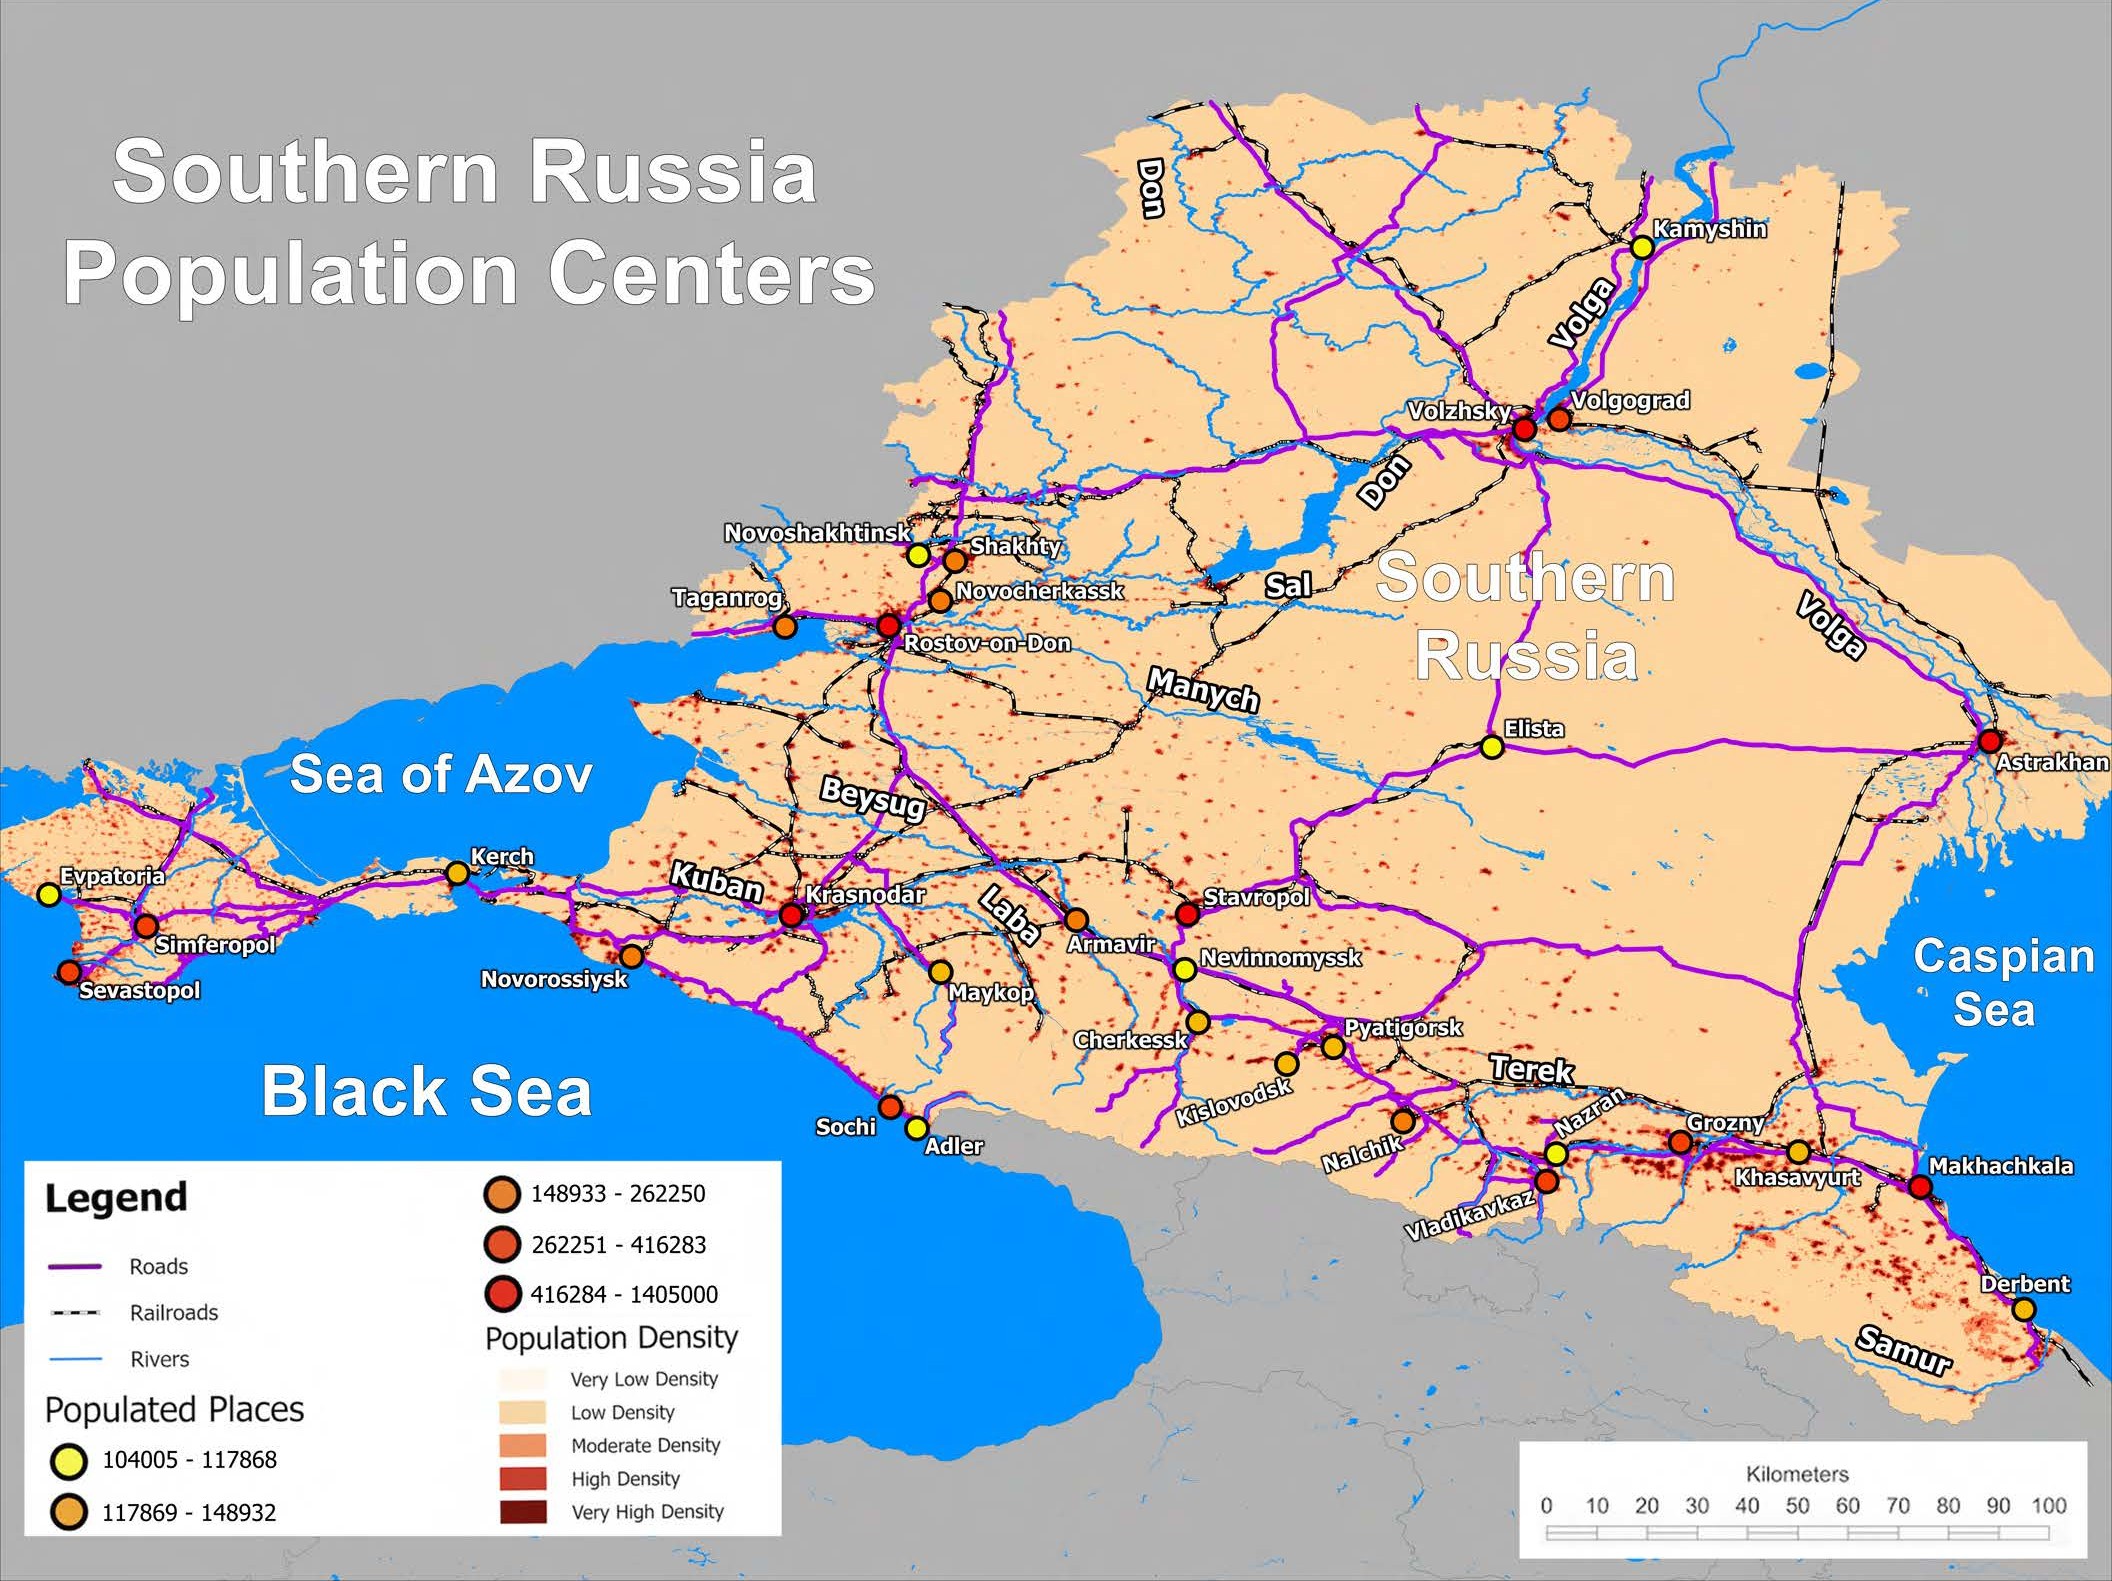
Geospatial intelligence work often faces a fundamental data problem: the most strategically significant information is the least openly available. For a 20-map series covering ethnic demographics, infrastructure corridors, and transportation networks across six Caucasus nations — produced for a U.S.-sponsored training program reaching 100+ government officials and academics — the geospatial datasets were unavailable, incomplete, or locked behind governments with no interest in sharing them. The maps were needed to help participants evaluate the region's spatial dynamics and understand its geopolitical and demographic complexity — information that shapes real policy and analytical decisions.
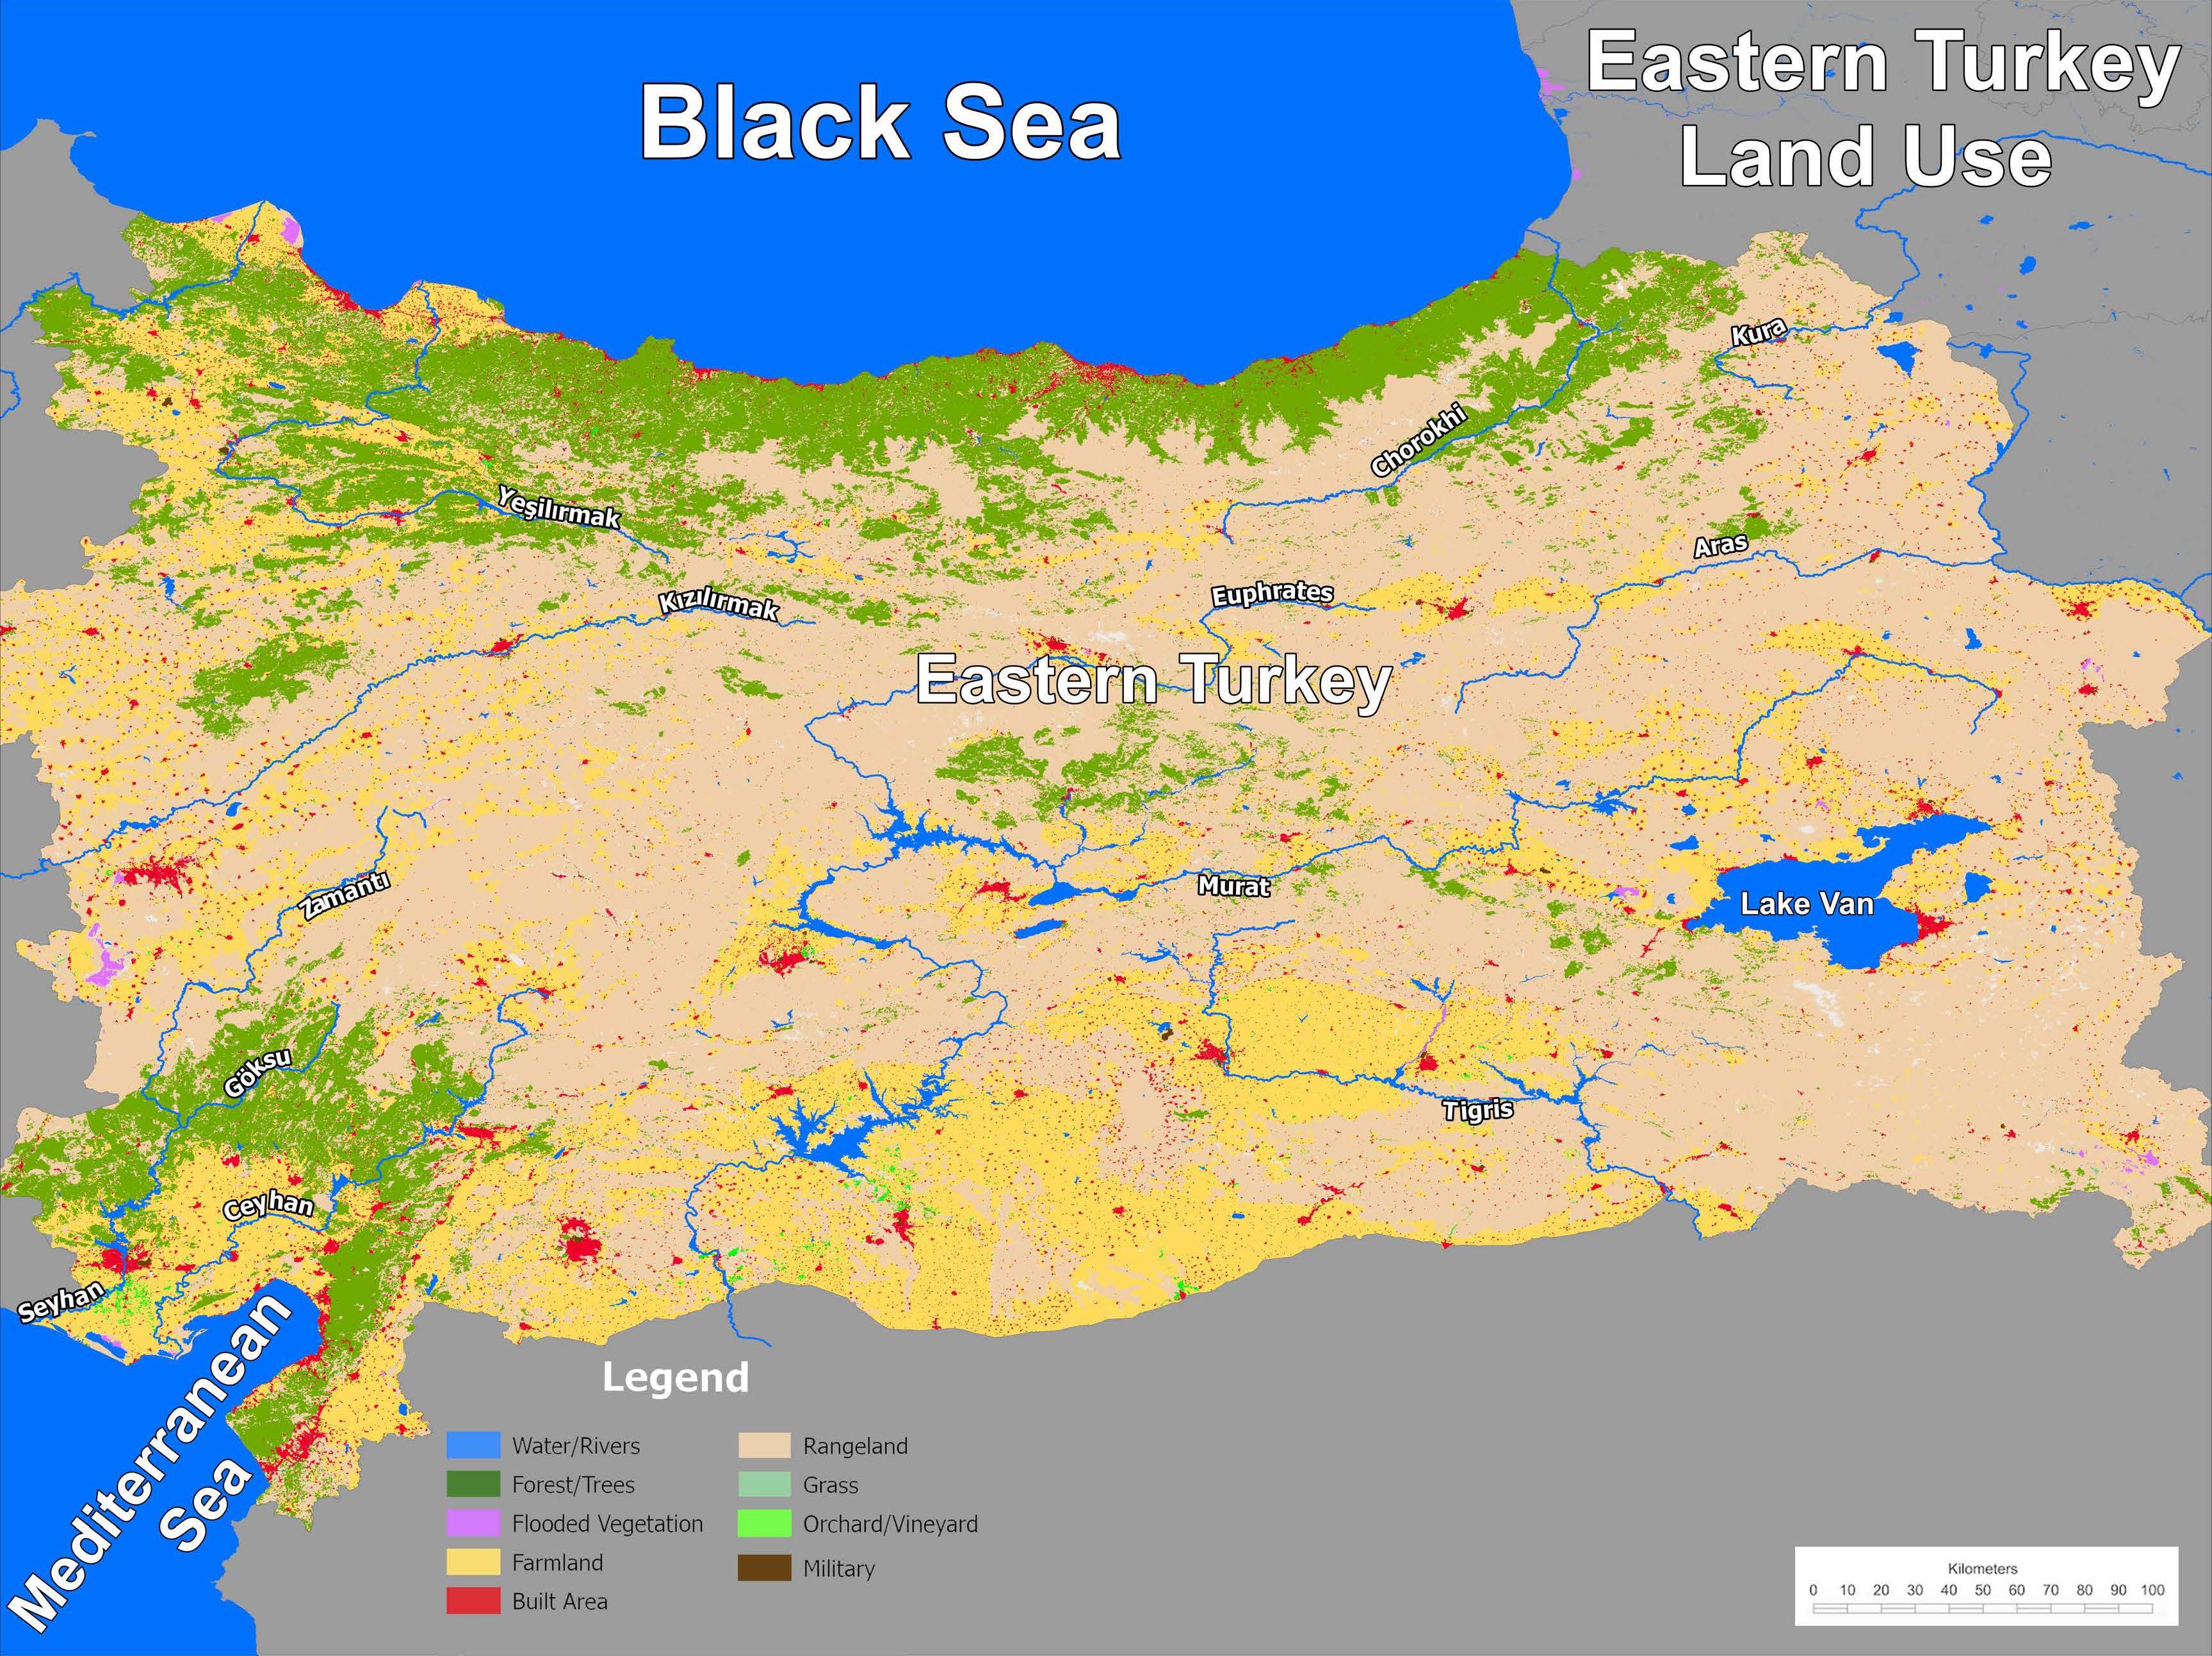
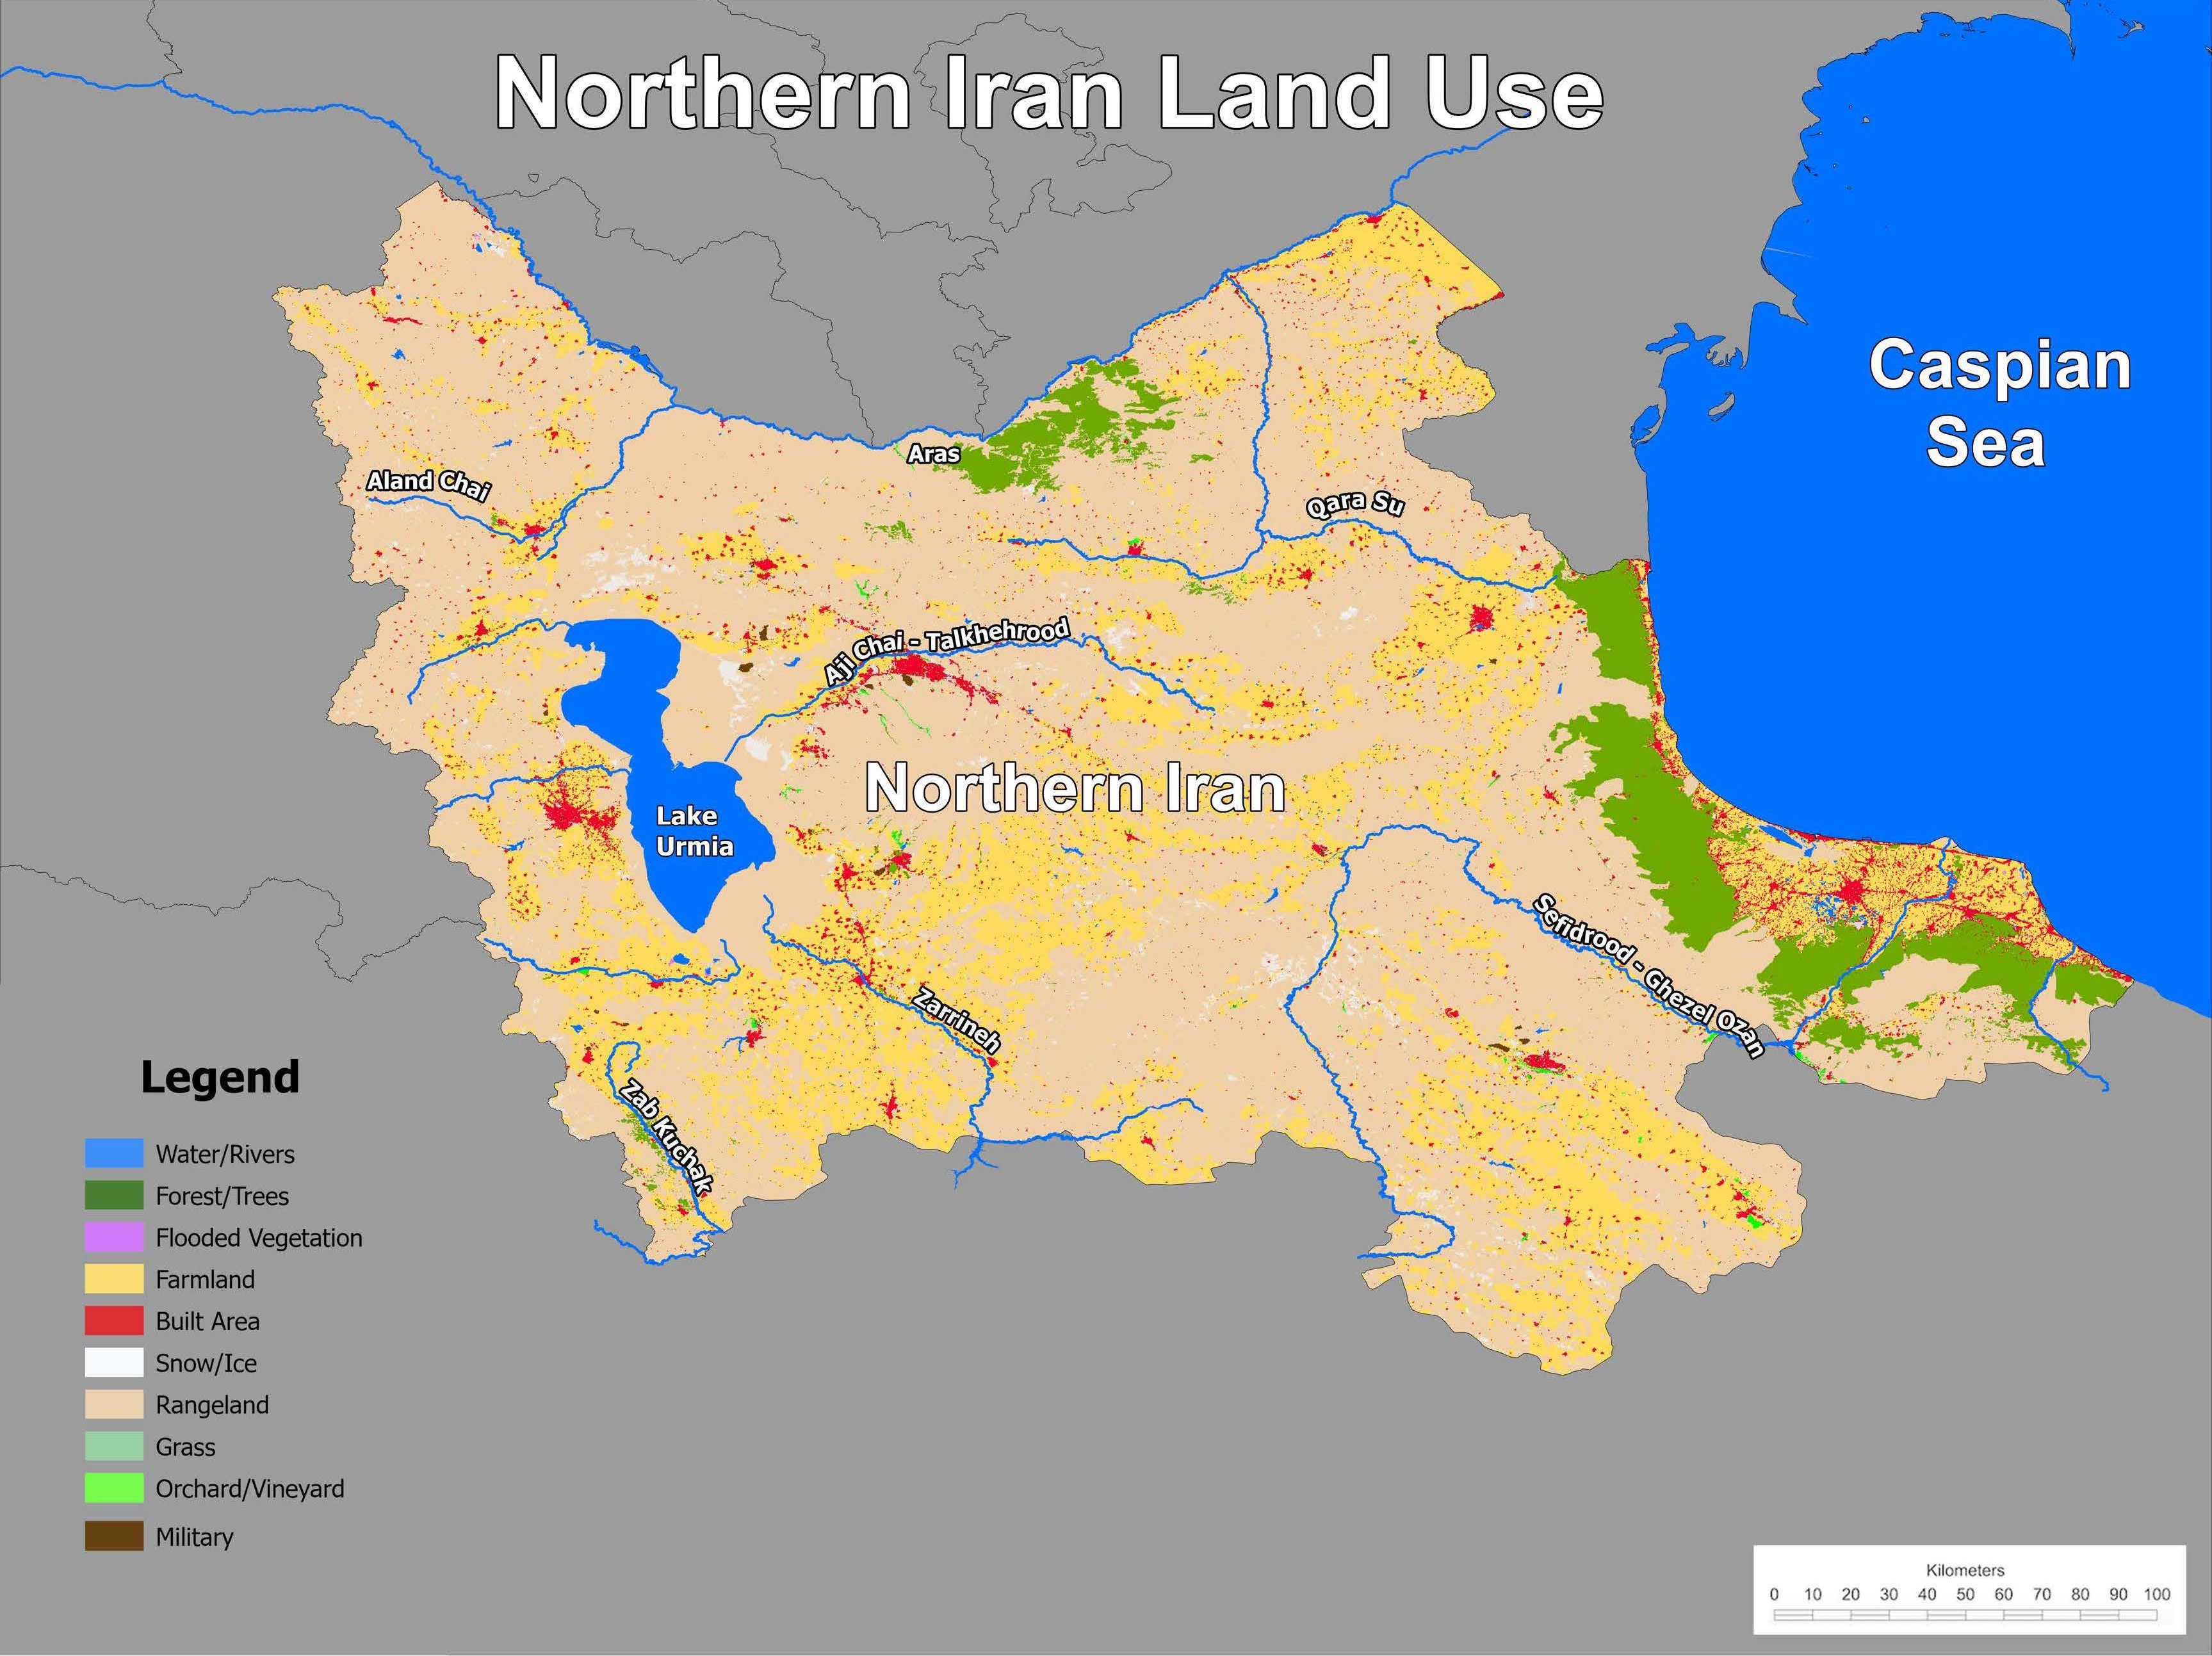
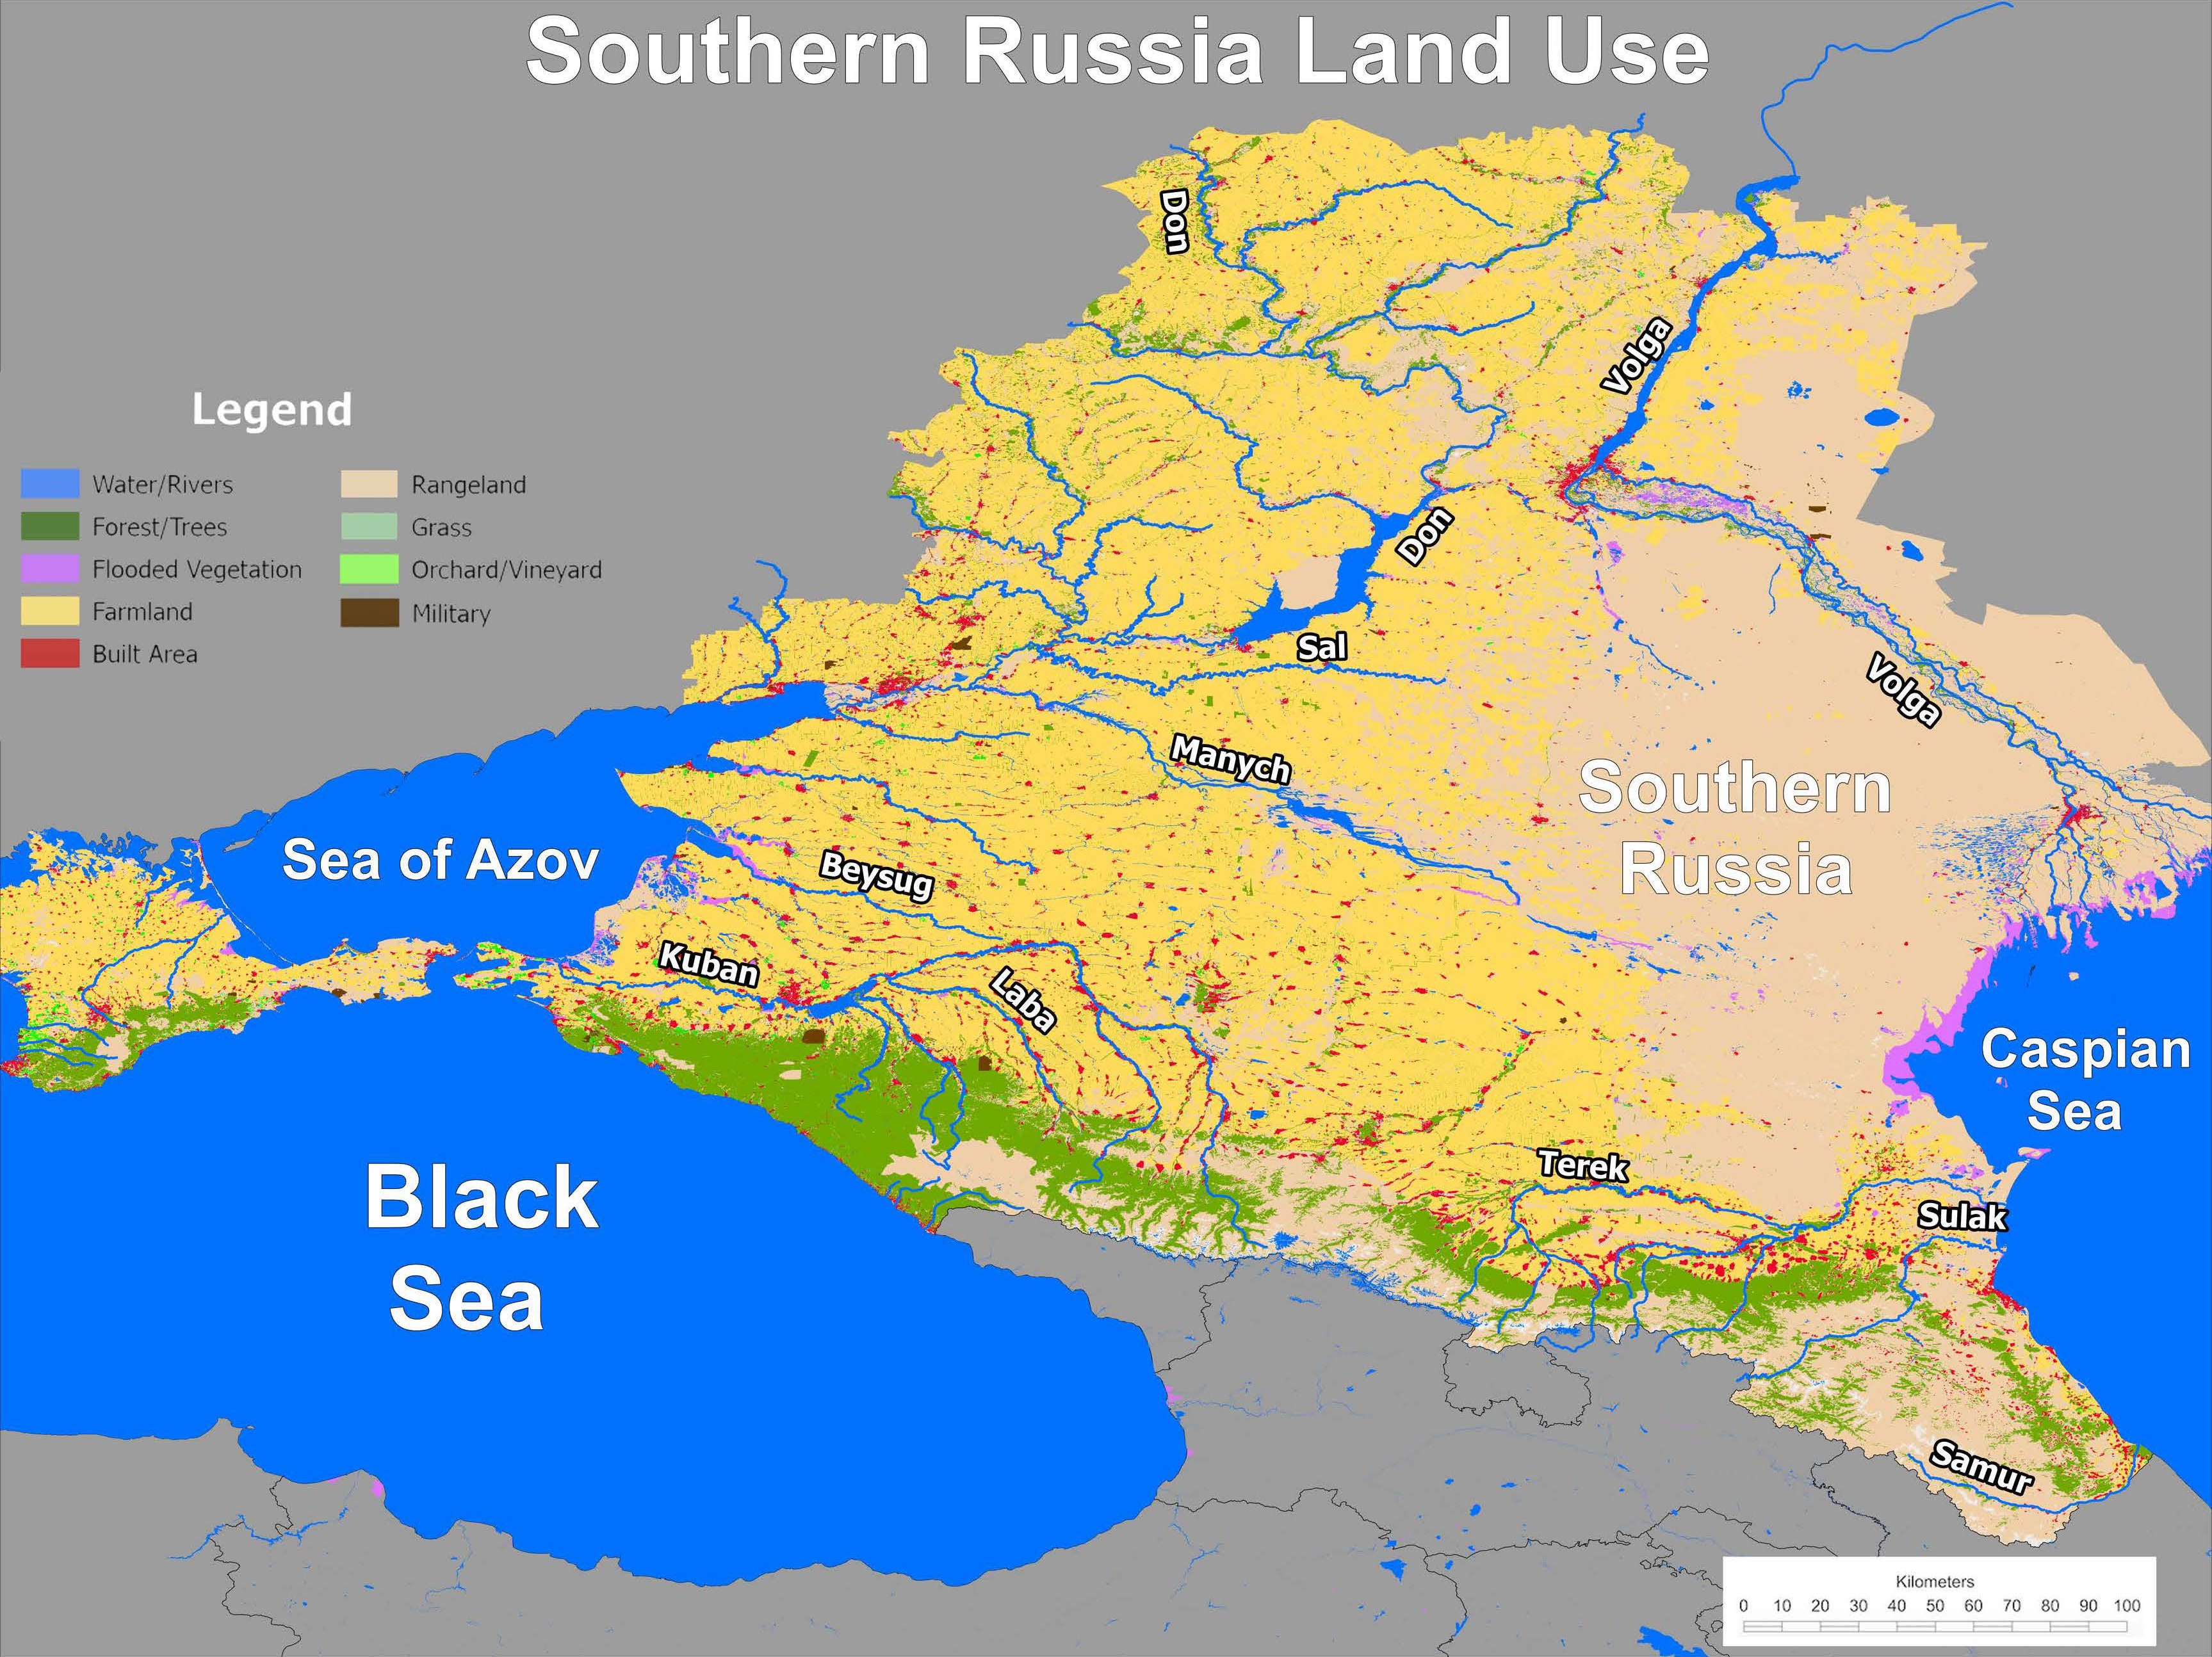
The solution was reconstruction. For each map category, available sources were identified — regional atlases, scanned historical maps, non-GIS publications with spatial information embedded. Those sources were georeferenced in ArcGIS Pro, then the features were hand-digitized: pipeline routes traced feature by feature, ethnic boundaries corrected against multiple cross-referenced sources, transportation networks extracted and validated against basemap imagery.
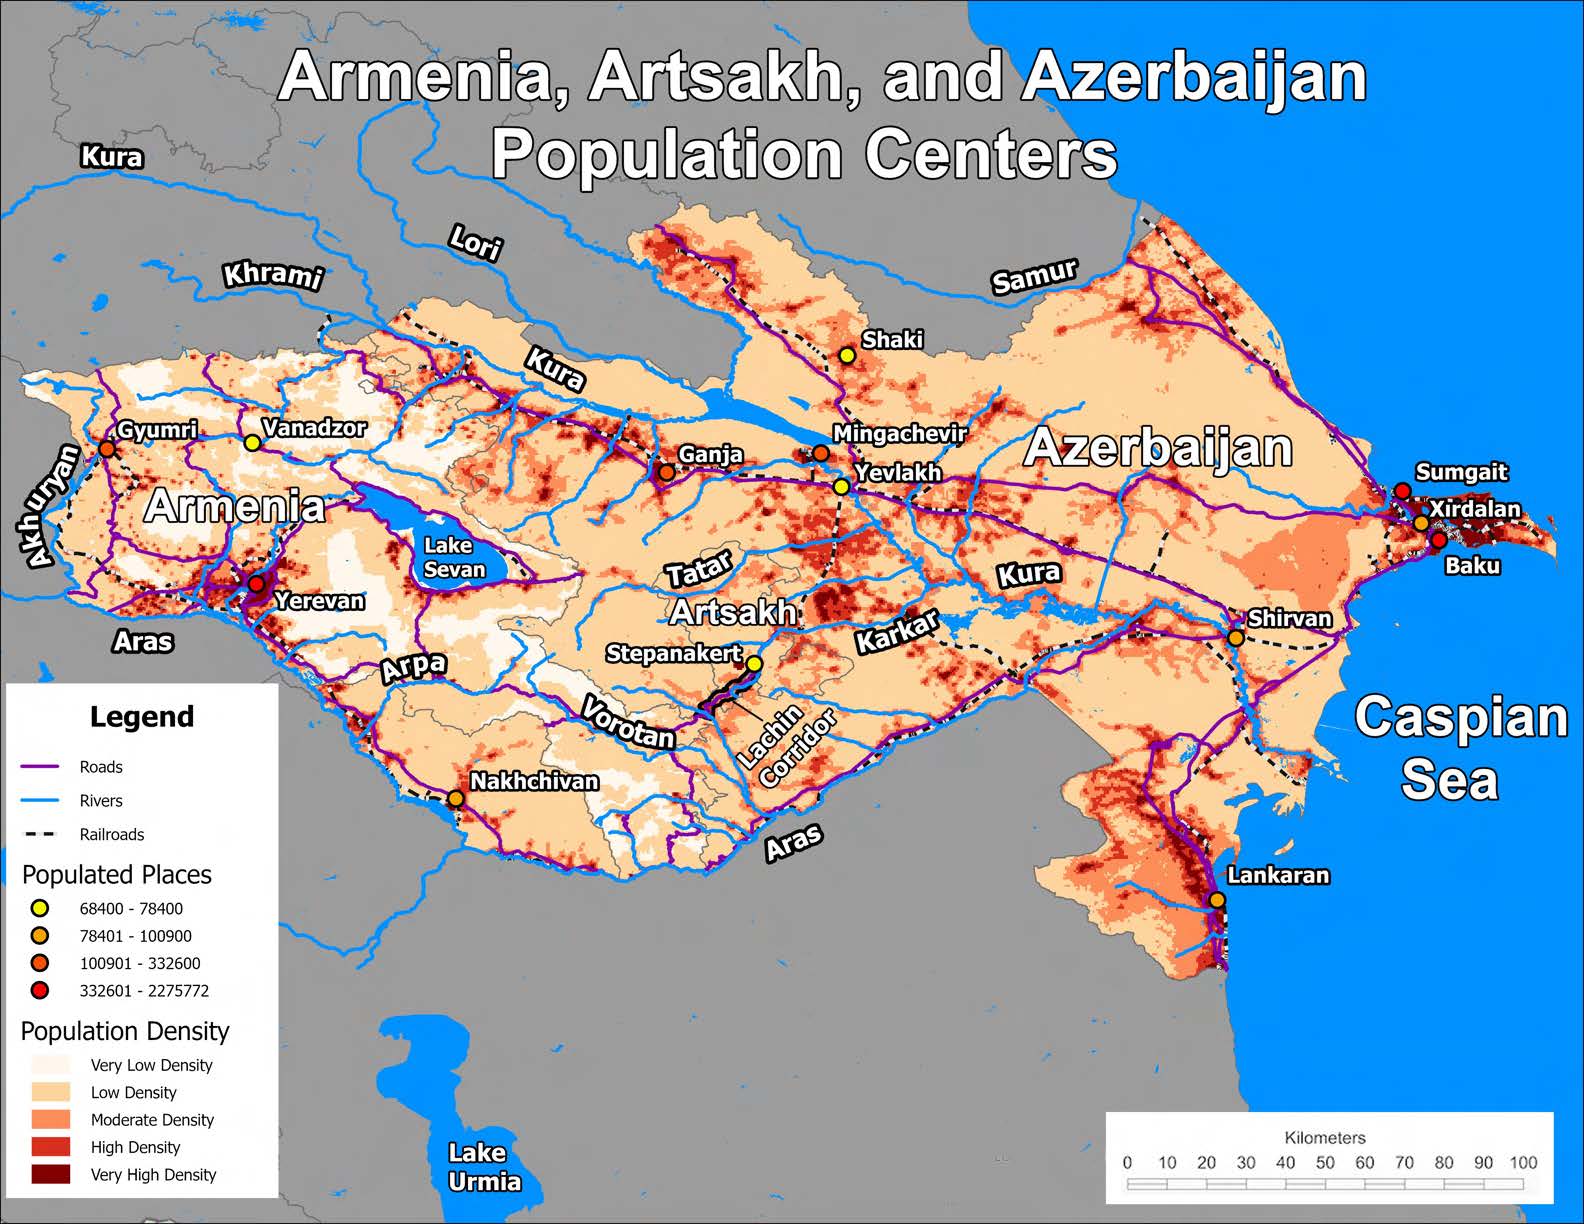
The most technically demanding work was the Caucasus demographic series — six maps showing ethnic group distribution across a region where borders are contested, populations are intermingled, and no single authoritative dataset covers all six countries. Every ethnic boundary required manual validation. Every classification decision was documented. The output had to hold up to expert scrutiny from specialists in the room who knew the region better than any public dataset.
Three maps — covering pipeline corridors and economic infrastructure routes — remain sensitive and are not shown here. They represent the most technically complex work of the project, and the most rigorous application of the reconstruction workflow.
"The data didn't exist. For six countries with contested borders and restricted government data, I had to reconstruct it — source by source, feature by feature, until it held up to scrutiny."
Process
-
1
Research Identified available sources for each map category; assessed gaps; located regional atlases, scanned maps, and non-GIS publications with spatial content.
-
2
Data Prep Georeferenced non-GIS source materials in ArcGIS Pro; hand-digitized features; cross-referenced ethnic boundaries across multiple sources.
-
3
GIS Work Adapted Python scripts to automate road network extraction and display; applied consistent symbolization across multi-country series; validated all features against basemap imagery.
-
4
Output 20-map series delivered; Python automation saved approximately 20 hours; 3 restricted maps not publicly shown.
When the standard datasets don't exist, the job is to reconstruct them — rigorously, documentably, and with enough cross-referencing that the output holds up to expert scrutiny. Noticing the gap and solving it before it becomes someone else's problem is the work.