The Problem This Solves
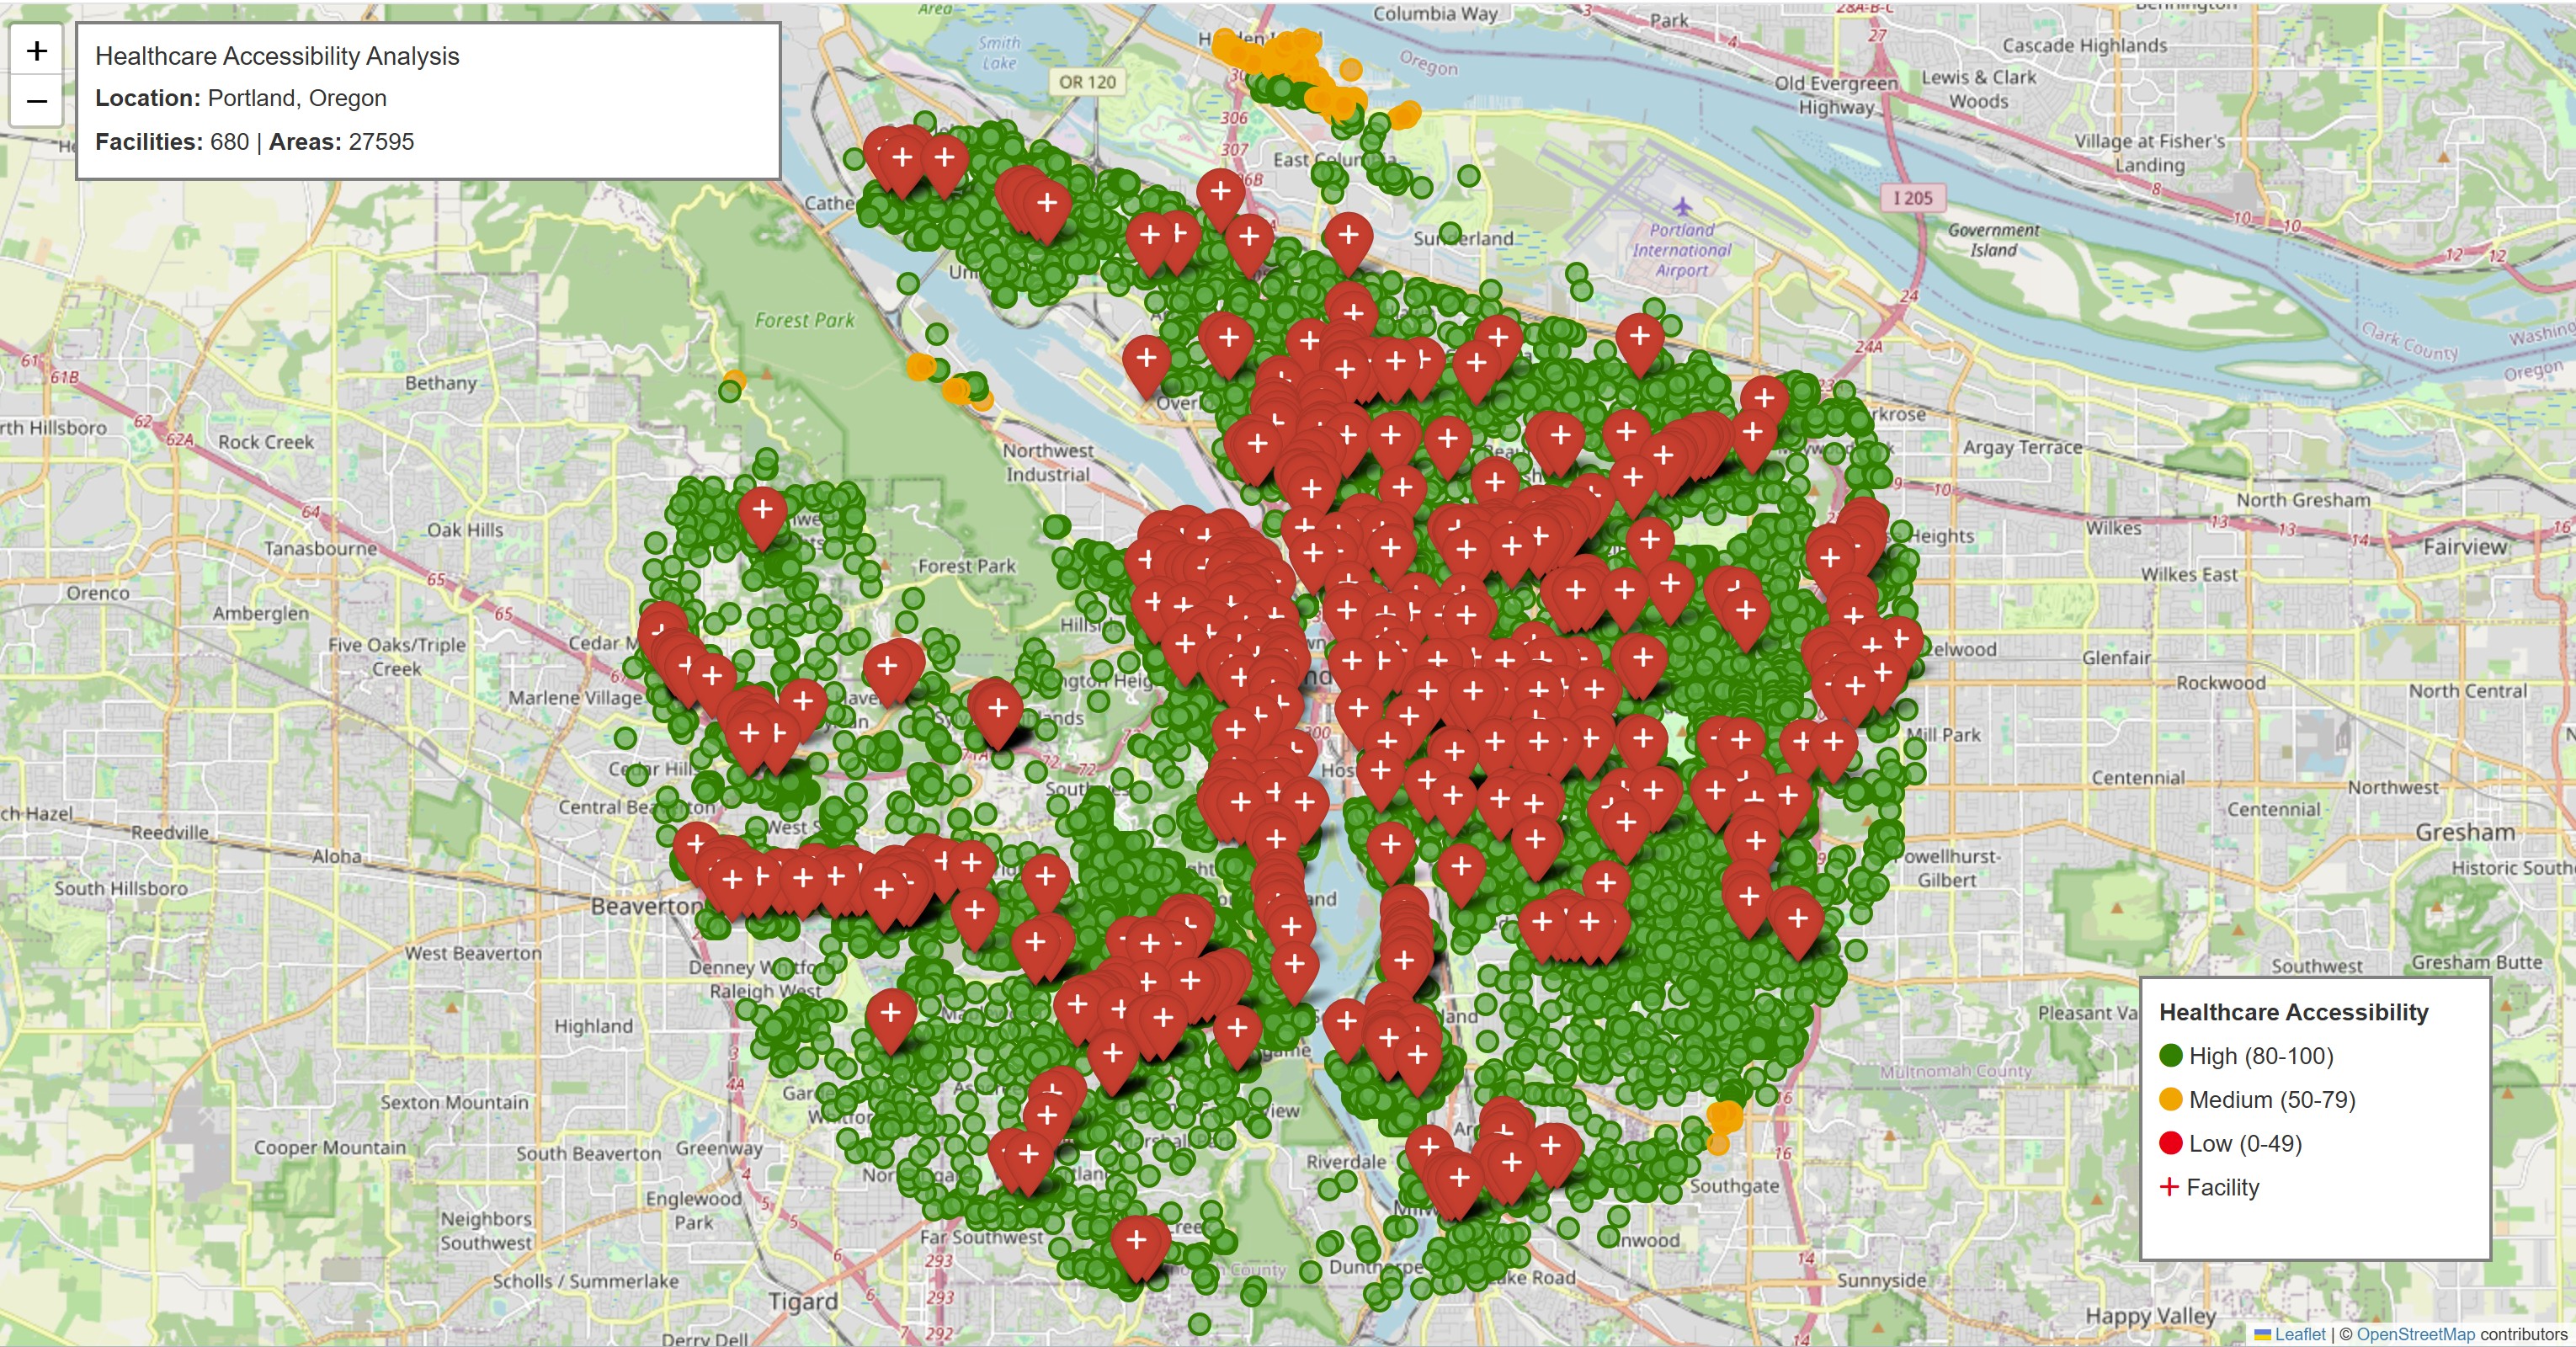
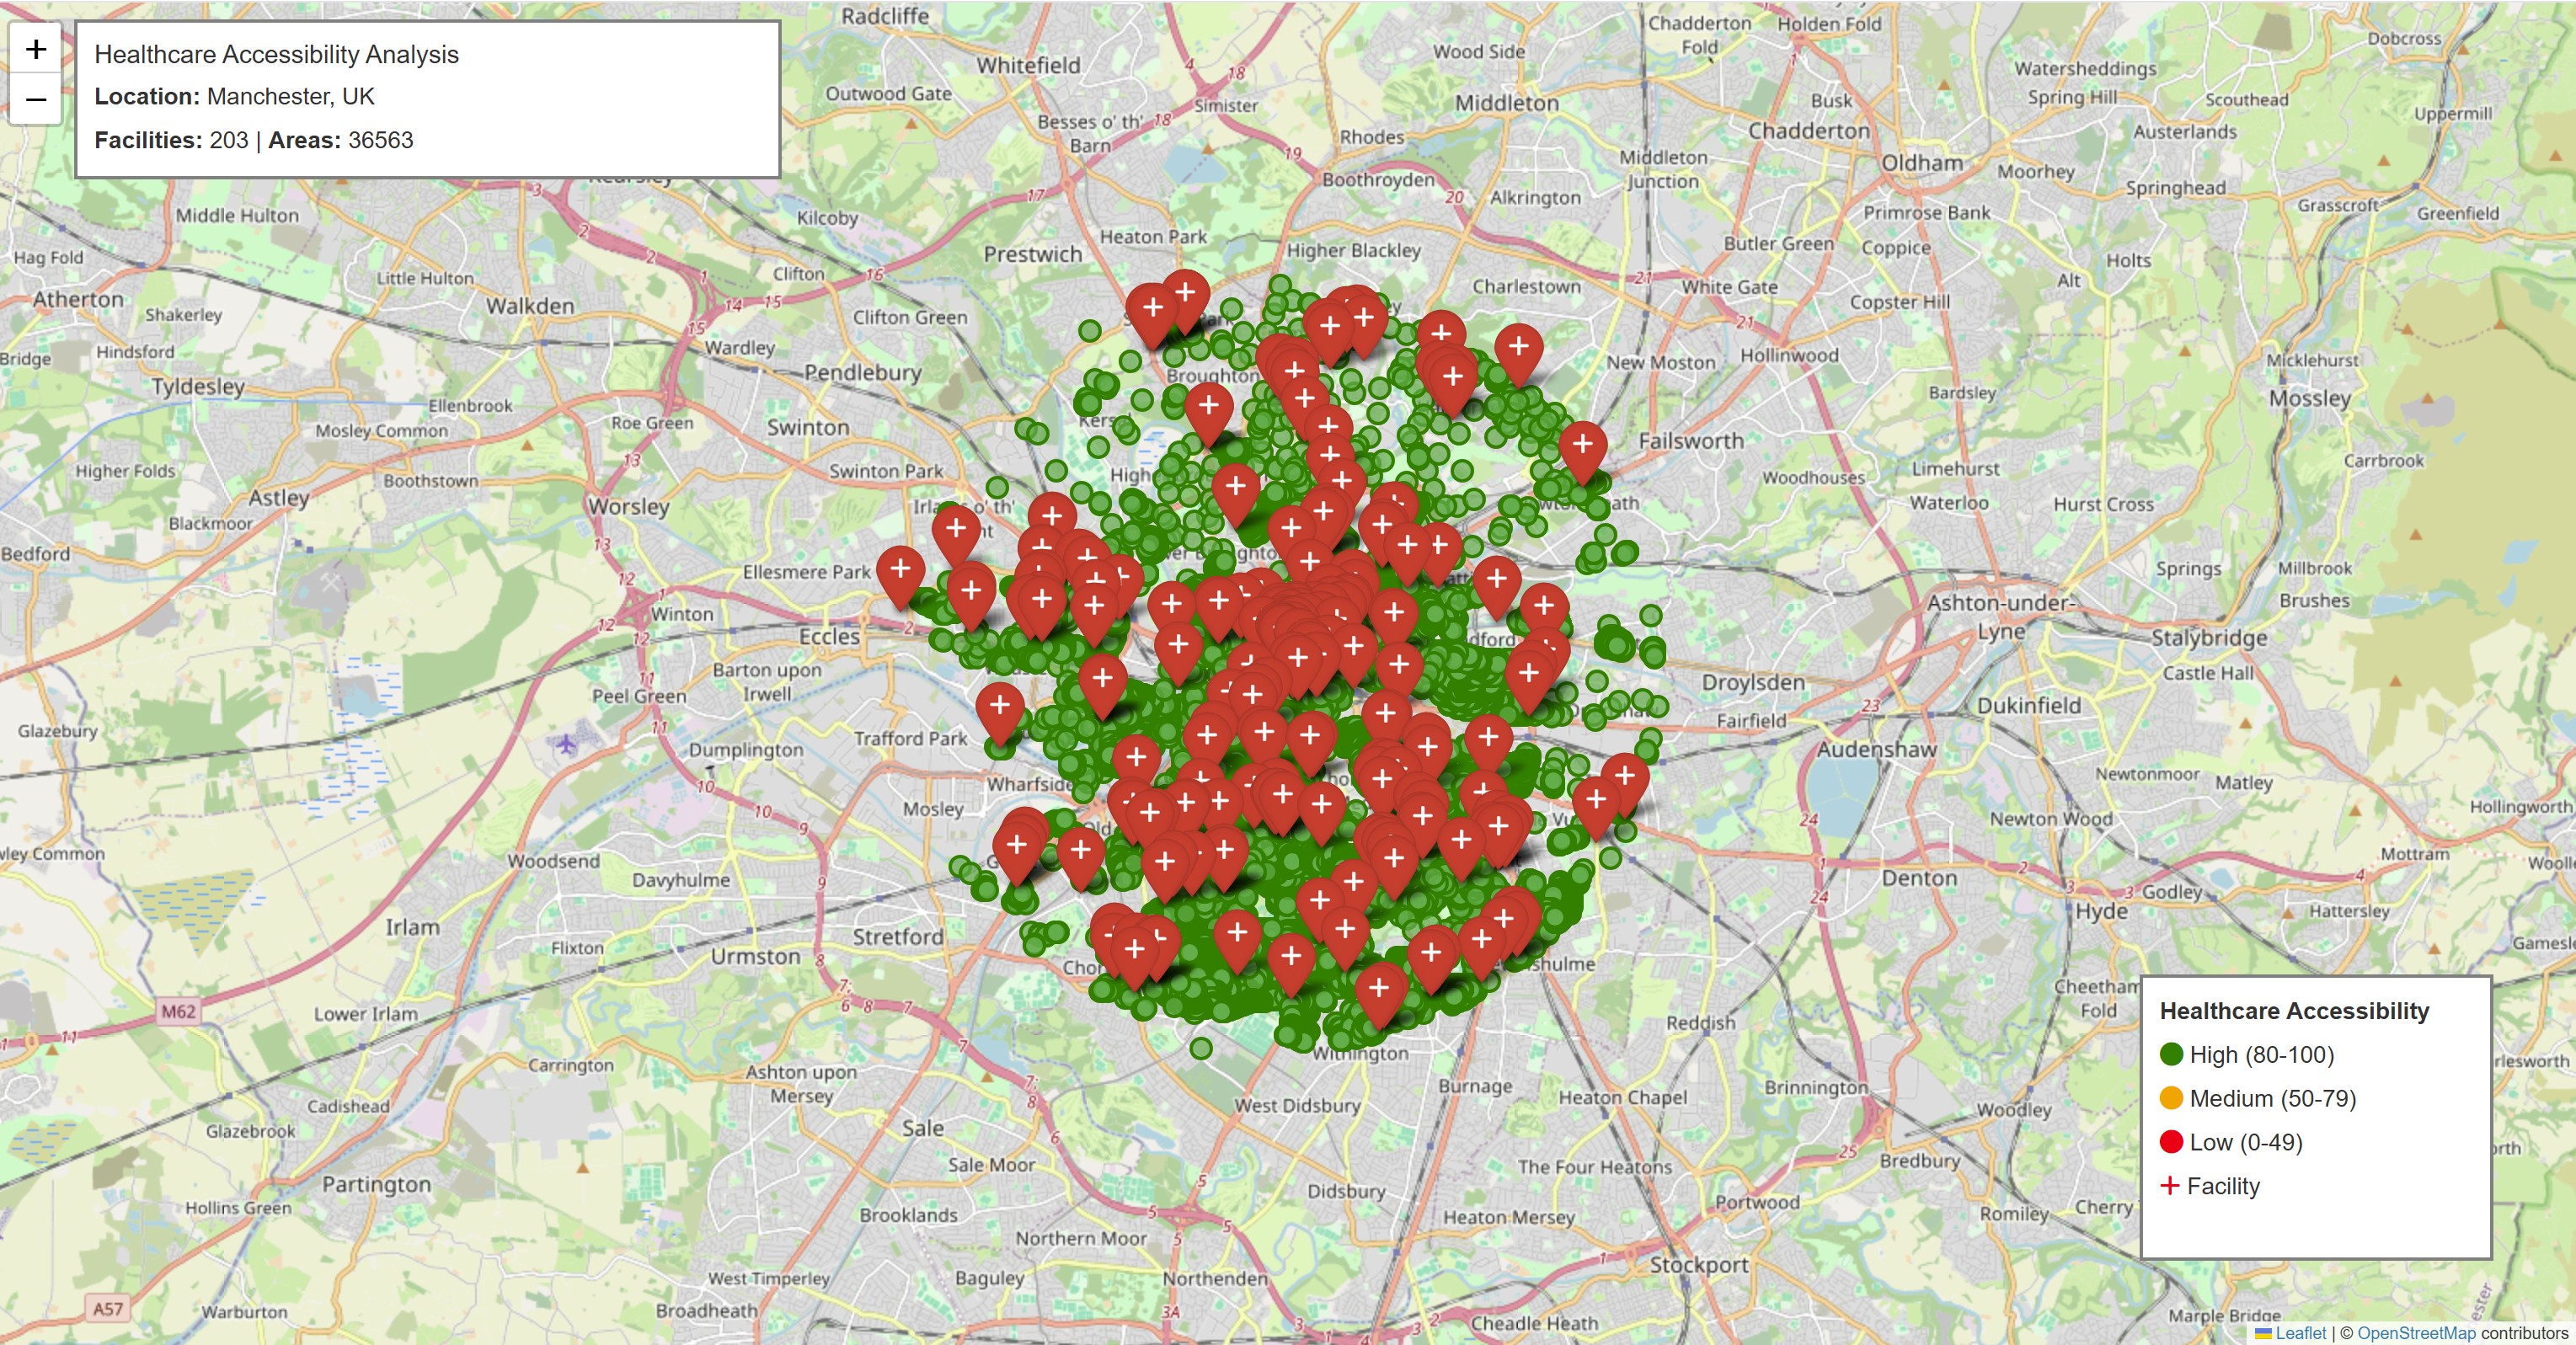
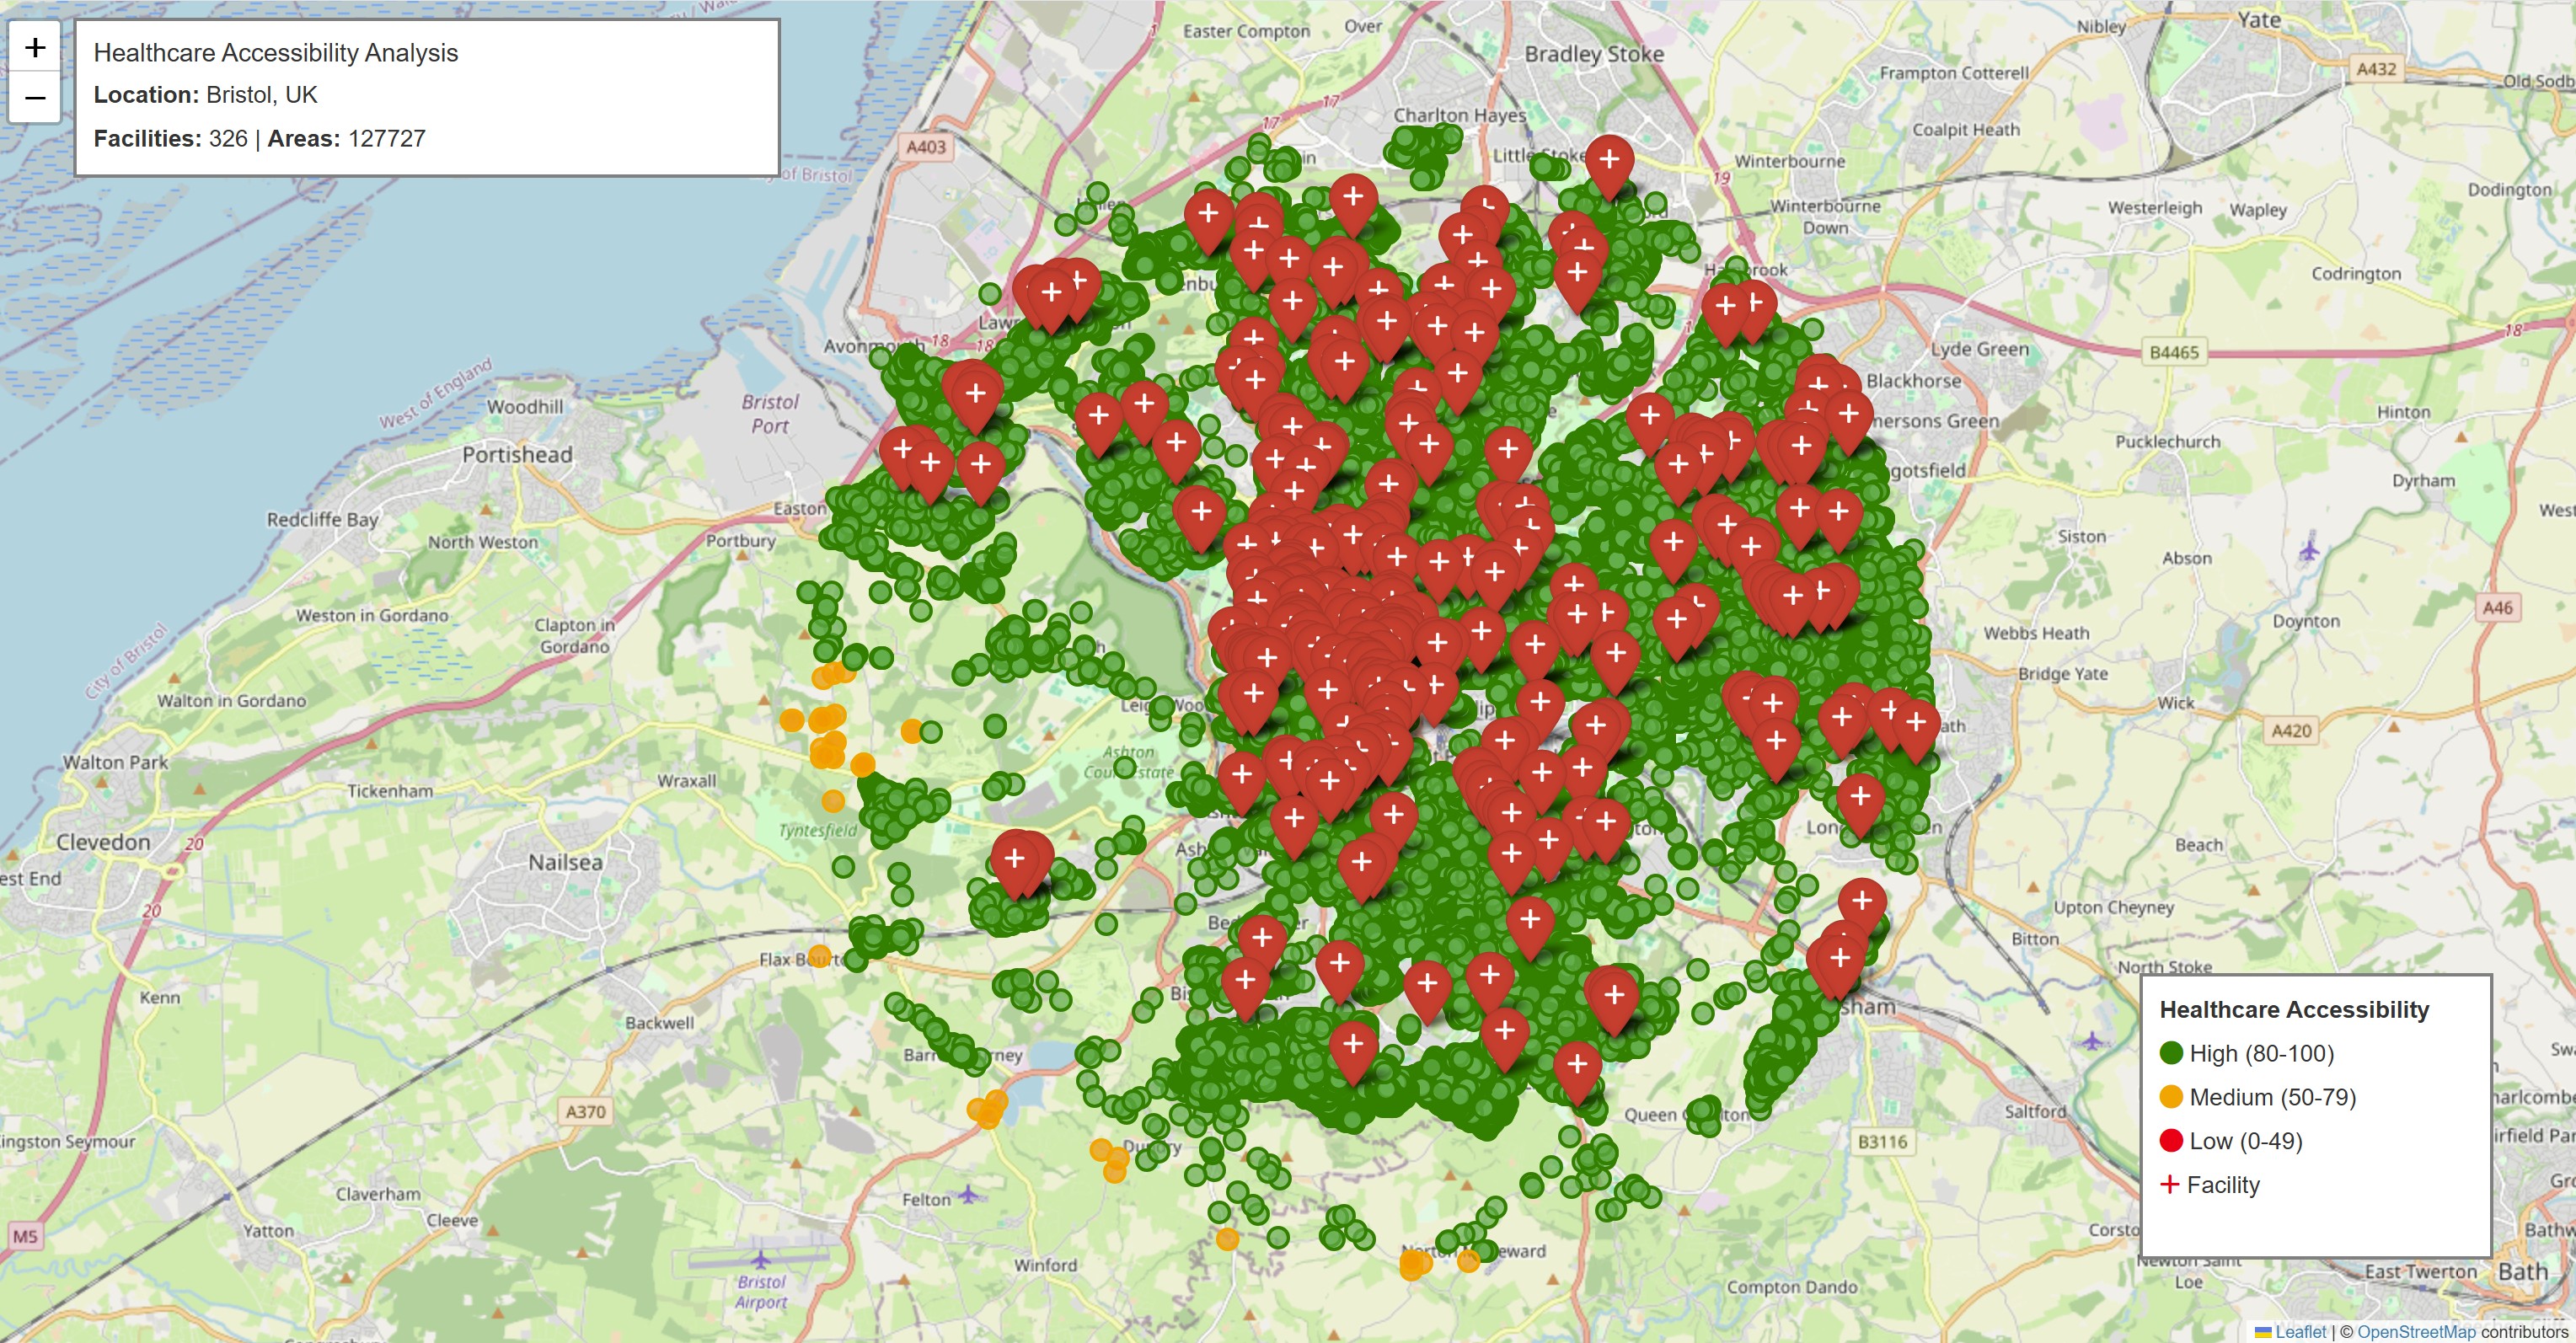
Spatial accessibility analysis addresses a core planning question: which populations lack adequate access to schools, healthcare, emergency services, or safe infrastructure — and exactly where are those gaps located? The challenge isn't just answering the question once. It's maintaining analytical consistency when the same question needs to be answered for Portland, Tokyo, São Paulo, and any other geography a planner or analyst is responsible for.
Five complete decision-support systems were built covering School Accessibility (Portland), Weather Vulnerability (Bristol), Multi-Hazard Emergency Response (Tokyo), Healthcare Accessibility (São Paulo), and Urban Accessibility (multi-city). Each required establishing the analytical framework first — what defines an accessibility gap, what datasets are needed, what a useful output looks like for the intended decision-maker — before any code was written. The result is a set of scalable pipelines that deliver consistent spatial decision support across any target geography without rebuilding from scratch.
The practical challenge was real: configuring Python environments, Jupyter Notebook libraries, and geospatial analysis pipelines to run reliably across multiple platforms required systematic dependency management and debugging. That configuration work is the gap that separates analysts who can actually run these workflows from those who only read about them.
These systems extend core GIS capability — they don't replace the analytical judgment required to define the spatial question, select appropriate methods, and validate the output. That judgment is still the job.
The Five Systems
Traditional GIS vs. Agentic GIS
- Manual, linear workflow
- Analyst loads each dataset
- One question, one output
- Re-run from scratch per city
- Analysis locked to analyst's time
- Dynamic, adaptive pipeline
- System discovers datasets
- Scales to any geography
- Consistent methodology across cities
- Analysis runs on demand
"The analytical value is in the reproducibility: the same spatial methodology applied to Portland, Tokyo, São Paulo, and any geography in between — producing consistent, decision-ready outputs without rebuilding the workflow from scratch each time."
Process
-
1
Research Studied agentic GIS architecture; identified OpenStreetMap datasets and geospatial libraries appropriate for each accessibility problem type.
-
2
Data Prep Configured Python environments and Jupyter dependencies; sourced OSM data for Portland, Bristol, Tokyo, São Paulo; structured spatial queries.
-
3
GIS Work Built 5 agentic spatial systems — school accessibility scoring, weather vulnerability assessment, multi-hazard response coordination, healthcare accessibility, urban accessibility gap analysis.
-
4
Output 5 complete systems; agentic pipelines adaptable across geographies; certified February 2026.
Even in agentic workflows — where the system does much of the execution automatically — the analytical framework has to be established first. What question is the system answering? What does a valid output look like? What failure modes need to be caught? The structure comes before any code runs.